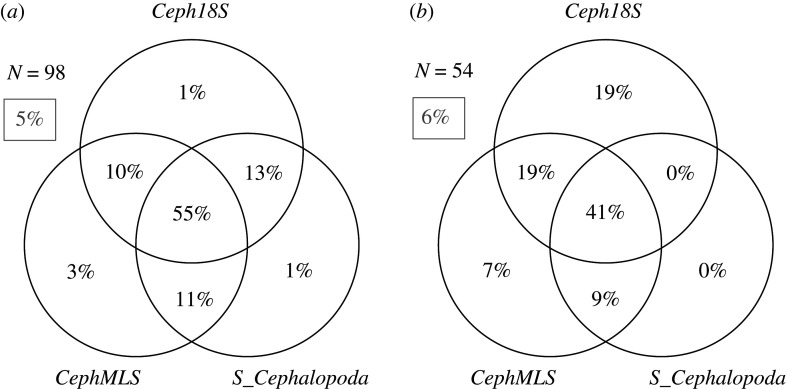
Figure 5.
Venn diagram of complementarity in (a) amplification and (b) identification between Ceph18S, CephMLS [41] and S_Cephalopoda [42]. N represents (a) the number of taxa that were present in both the 16S and 18S GenBank reference databases, and (b) the number of taxa amplified by all three primer sets (i.e. the middle plane of (a) is the subset used for (b)). Grey percentage in the box is the number of taxa that could not be (a) amplified and (b) identified by either primer set. Sum of percentages may deviate ±1% due to rounding.

