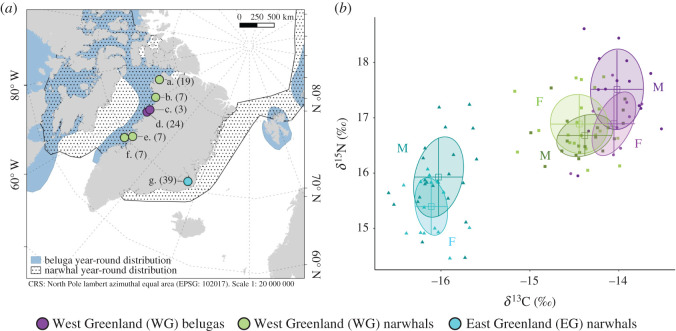
Figure 1.
(a) Sample localities (a: Qaanaaq, b: Melville Bay, c: Kullorsuaq, d: Nuussuaq, e: Uummannaq, f: Qeqertarsuaq, g: Scoresbysund) with sample size and distribution of belugas and narwhals [29]. The WG narwhal population comprises samples from four localities. Coastline data are from [30]. (b) Bone δ13C and δ15N for male and female WG belugas (nM = 14, nF = 9), WG narwhals (nM = 19, nF = 20) and EG narwhals (nM = 22, nF = 16). Solid circles indicate Bayesian standard ellipse areas (SEAB). Mean (square) and s.d. (error bars) are indicated.

