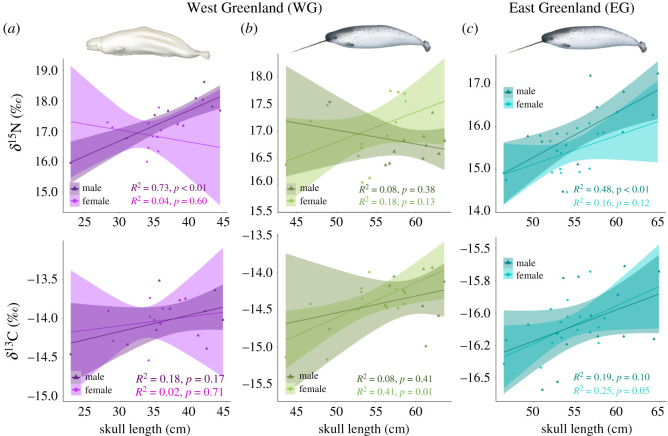
Figure 3.
Variation in δ13C and δ15N from bone samples according to skull length (cm) for male and female (a) WG belugas (nM = 12, nF = 9), (b) WG narwhals (nM = 11, nF = 14) and (c) EG narwhal (nM = 15, nF = 16). The regression lines for each sex and their confidence intervals (shading) are plotted, with females in a lighter colour shade than males. Beluga and narwhal illustrations are from Uko Gorter.

