
Figure 4.
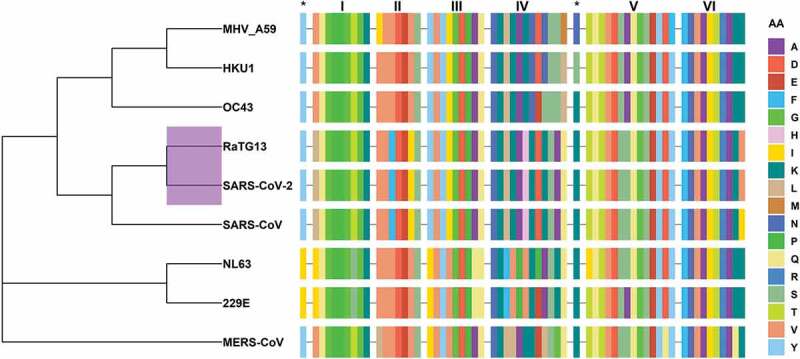
Phylogenetic analyses of CoVs and conservation of motifs among selected CoVs. The dendrogram shows the evolutionary relationship among hCoVs, MHV and RaTG13 using amino acid sequence of nsp13. Note that SARS-VoV-2 is closely related to RaTG13 (purple highlighted node). This figure also shows the sequence alignment of six conserved nsp13 motifs together with SSYA10–001 binding site residues marked as asterisks (*). The amino acid sequence is color coded. Dash (–) represents the gap in the sequences of nsp13, and AA represents amino acids. The figure was generated using the R package ggtree [61]. The R programing language [62] was used to generate this figure, Figures 6 and 7. The in-house generated R codes for these figures are available upon request