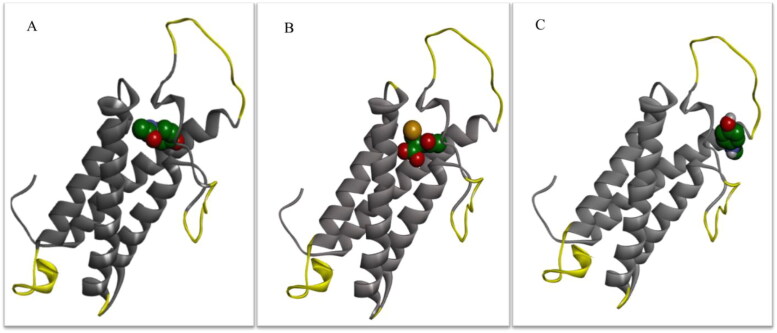
Figure 6.
Three-dimensional representation of the regions with the greatest fluctuation during MD simulation of the hVKOR homology model with three ligands. Yellow highlighted regions of the hVKOR with the greatest fluctuations in RMSF plot for (A) NAPQI; (B) NAC; (C) Acetaminophen during 20 ns of MD simulation.

