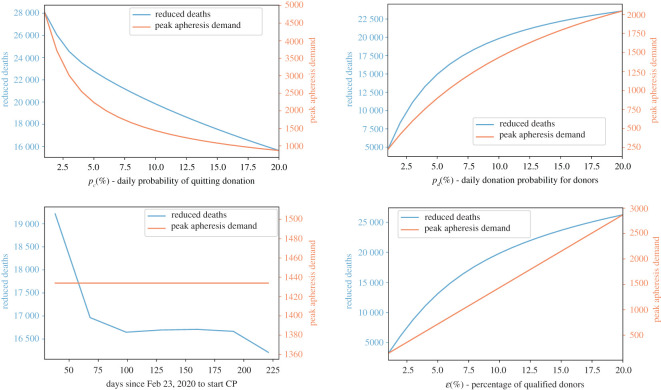
Figure 8.
Reduced deaths versus apheresis demands. The left-hand side axis of each figure measures the total number of deaths that could be avoided by the end of year 2020 via applying CP therapy under various levels of donation adherence (pc), donation participation (pd), start time and percentage of qualified donors (ɛ). The right-hand side axis of each figure measures the peak time demand of apheresis.

