Figure 2.

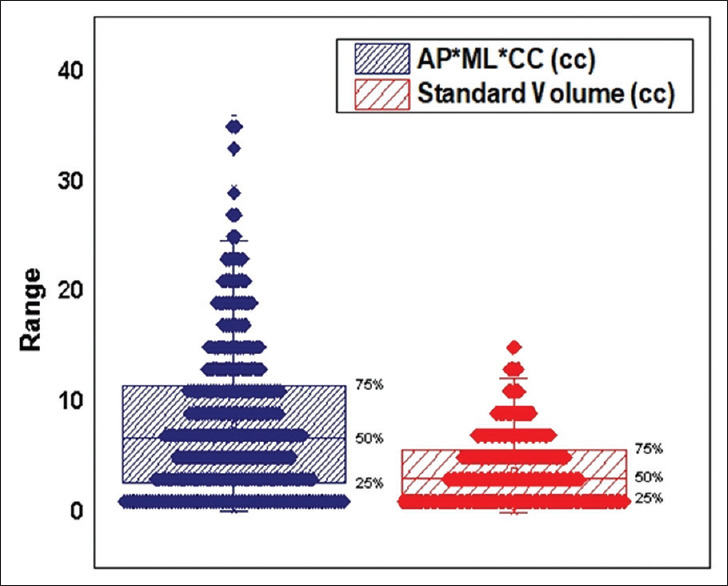
Box plot: The distribution of standard volumes and the product of diameters along with lower quartile, upper quartile and median

Box plot: The distribution of standard volumes and the product of diameters along with lower quartile, upper quartile and median