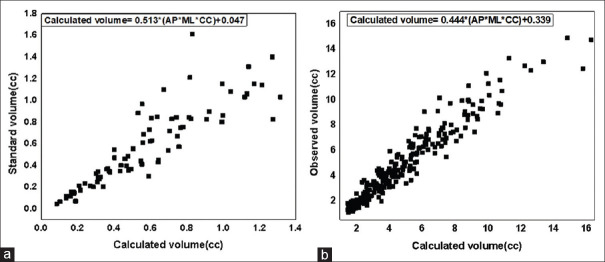
Figure 4.
(a) Scatter plot: The standard volumes plotted against the product of three diameters with best fit line displayed for product of diameters in the range 0–2.5 cc (Group 1) (b) Scatter plot: The standard volumes plotted against the product of three diameters with best fit line displayed for products of diameters in the range 2.5–36cc (Group-2)

