
Figure 3.
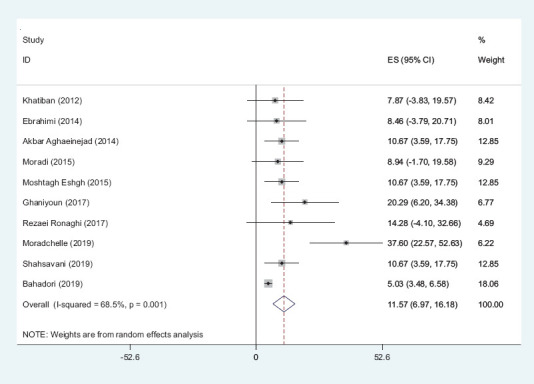
Forest plot for the average frequency of depersonalization in general and in individual studies with 95% confidence intervals
Official websites use .gov
A
.gov website belongs to an official
government organization in the United States.
Secure .gov websites use HTTPS
A lock (
) or https:// means you've safely
connected to the .gov website. Share sensitive
information only on official, secure websites.
Forest plot for the average frequency of depersonalization in general and in individual studies with 95% confidence intervals