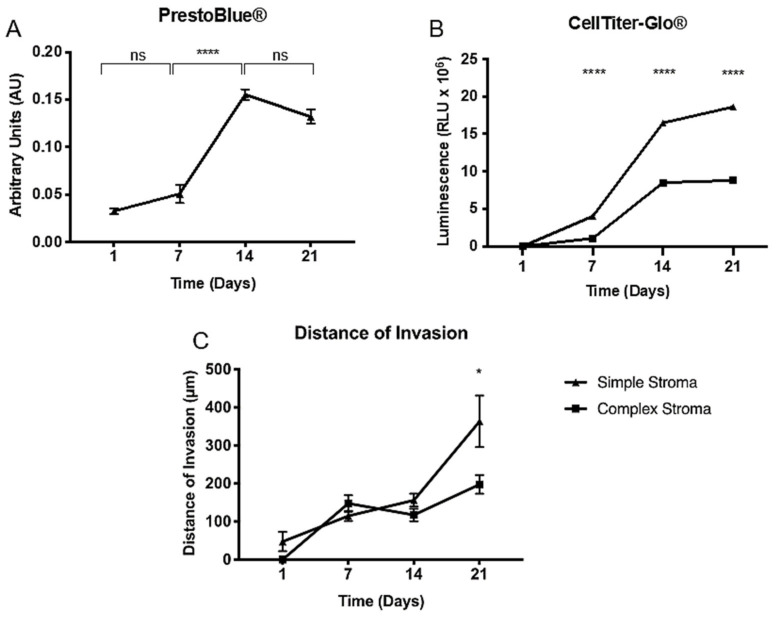
Figure 5.
Metabolic activity measured in pancreatic tumouroids. (A) PrestoBlue® and (B) CellTiter-Glo® readings for MIA Paca-2 tumouroids over days 1, 7, 14, and 21. Values are (mean ± SEM) with n = 3 and three technical repeats and unpaired t-test with p-values ≤ 0.00005 **** for (A,B). (C) Distance of invasion from the MIA Paca-2 ACM into the fibrous stromal compartment. Values are (mean ± SEM) with n = 3 and three technical repeats. Mann–Whitney p-value ≤ 0.05 *.

