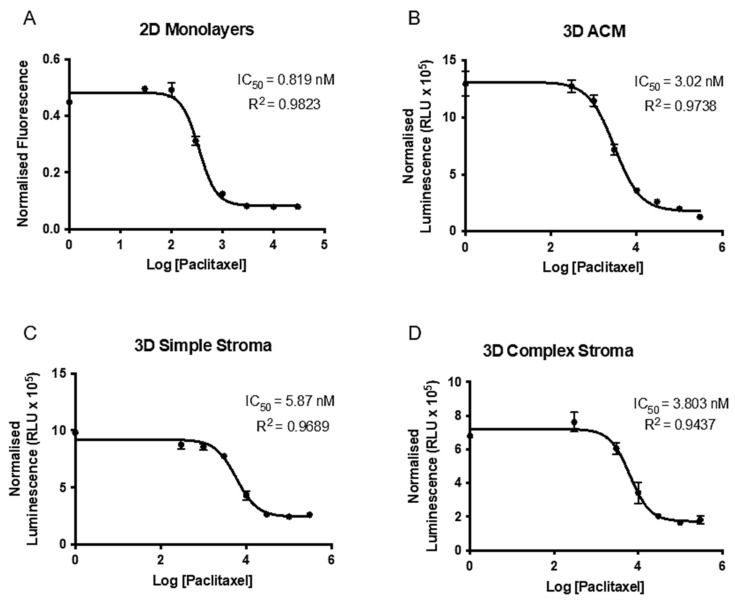
Figure 6.
Dose response curve to increasing paclitaxel concentrations in 2D and 3D.(A) Seven increasing paclitaxel concentrations were used in 500 cells/well in a 2D set-up to establish initial IC50 values for MIA Paca-2 cells. (B) Dose response curve to increasing paclitaxel concentrations in 3D MIA Paca-2 ACMs and tumouroids with a (C) simple stroma or (D) complex stroma. Data represent (mean ± SEM) with n = 3 and three technical repeats. Values were normalized to DMSO vehicle control, transformed, and a non-linear fit was applied.

