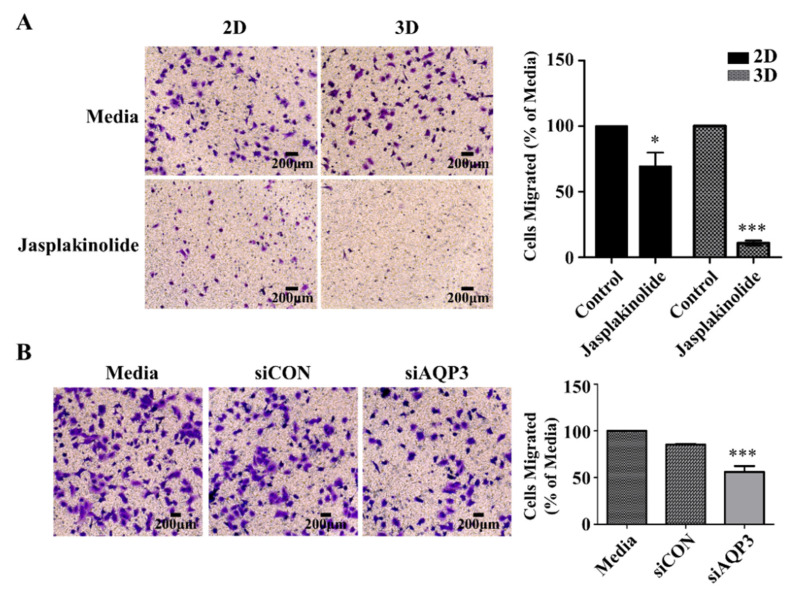
Figure 6.
Protrusion controls migration and invasion of A549 cancer cells. (A) The phase-contrast micrograph of the migration of NSCLC A549 cells (left) and quantification (right) in the Transwell assay. The quantification of migrated cells treated with jasplakinolide represents three independent experiments, and the values represent the mean ± SEM of triplicate samples. The differences in expression levels were evaluated for significance using unpaired two-tailed t-test. * p < 0.05; ** p < 0.01; and *** p < 0.001. (B) Representative images (left) and quantification (right) of A549 spheroid transfected with siRNA AQP3. Twenty-four h following siRNA transfection in 2D culture condition, the cells were further incubated in the 2D or 3D culture condition. The migration capacity of the A549 spheroids with a knocked down level of AQP3 was much lower than that of the negative control cells. The differences in expression levels were evaluated for significance using one-way ANOVA followed by Tukey’s post-hoc tests. * p < 0.05; ** p < 0.01; and *** p < 0.001.

