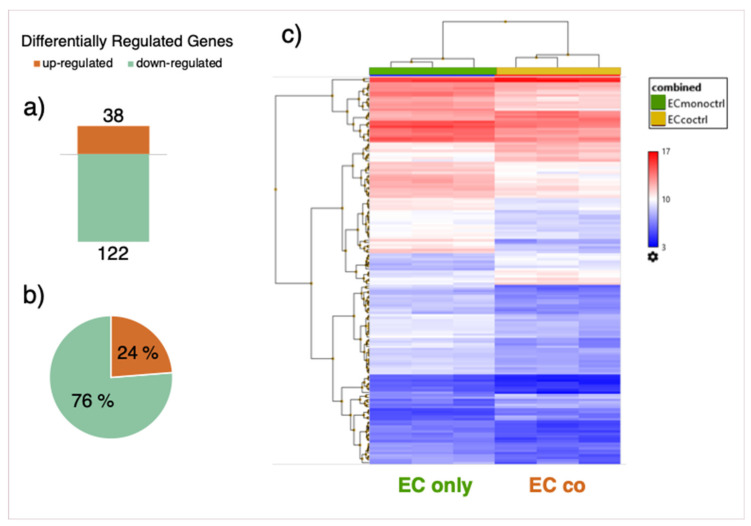
Figure 6.
Differentially regulated genes (DRGs). Number of DRGs in co-cultured vs. mono-cultured endothelial cells (ECs). A total of 38 genes were upregulated, while 122 genes were downregulated (a). Pie chart representation of the same data as in (a) denoting up-and downregulated genes in% of total number of DRGs (b). Heat map representation of DRGs (c). Comparison of gene expression data in co-cultures vs. mono-cultured ECs was performed by using Transcriptome Analysis Console (TAC, Applied Biosystems). For the analysis, a fold change (FC) cut-off of 1.5 (log2FC ± 0.59) and an FDR p-value of 0.05 were applied.

