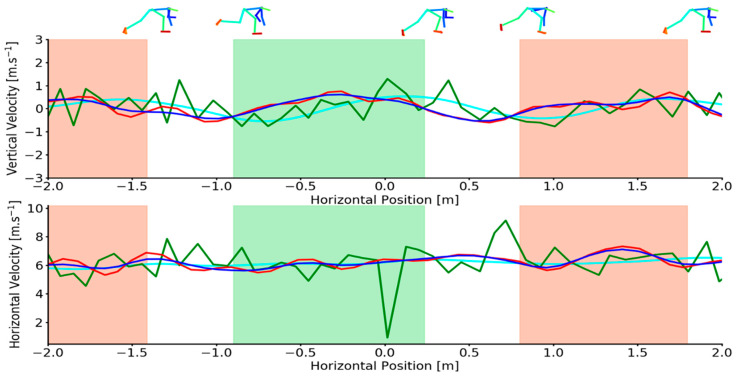
Figure 5.
Upper-Example individual trial demonstrating vertical CoM velocities for criterion (cyan), unfiltered (green), low-pass filtered (red) and Kalman smoothed (blue) data as a function of horizontal CoM position during sprinting. Lower-Example individual trial demonstrating horizontal CoM velocities for criterion (cyan), unfiltered (green), low-pass filtered (red) and Kalman smoothed (blue) data as a function of horizontal CoM position during pushing. Shaded areas depict the left foot (red shading) and right foot (green shading) stance phase. Footfall events were computed from marker-based foot kinematics [31]. OpenPose joint centre reconstructions (top) at touch-down and toe-off events are overlaid for context.

