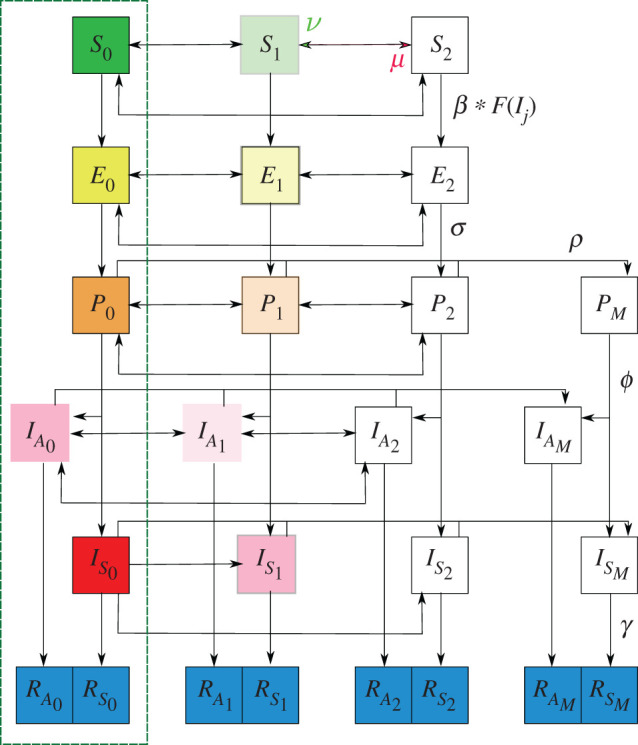
Figure 1.

Graphical representation of the SEIR model used throughout the manuscript. We use fading to indicate a reduction in transmission which comes from distancing/isolation and also from the asymptomatic disease carriers being less infectious. These effects are quantified by δ and α respectively in the full model detailed in appendix A. For a condensed graphical representation, we have indicated a representative parameter on particular arrows; however, in general each parameter has a subscript (i, j) indicating the originating and terminal compartment respectively, details of which are in the main text. The parameter μ (red arrowhead in figure) indicates distancing to a higher category while ν (green arrowhead in figure) indicates relaxing down to a lower category. F(Ij) represents the force of infection indicating that susceptible people require interaction with one of the infected classes for successful disease transmission. The portion of the model in the green rectangle is the model when social distancing and testing is not considered.
