Fig. 4.

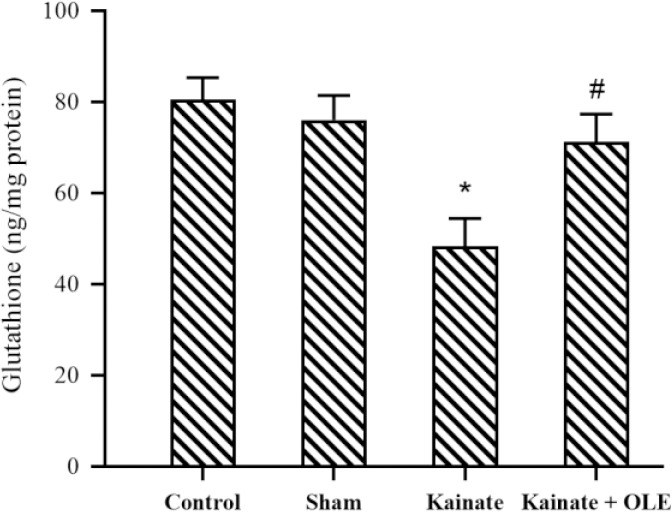
Alterations of hippocampus glutathione in different groups. Data are presented as mean ± SEM. *P < 0.05 Indicates significant difference compared with sham group and #P < 0.05 vs kainate group. OLE, Olive leaf extract.

Alterations of hippocampus glutathione in different groups. Data are presented as mean ± SEM. *P < 0.05 Indicates significant difference compared with sham group and #P < 0.05 vs kainate group. OLE, Olive leaf extract.