Figure 1.
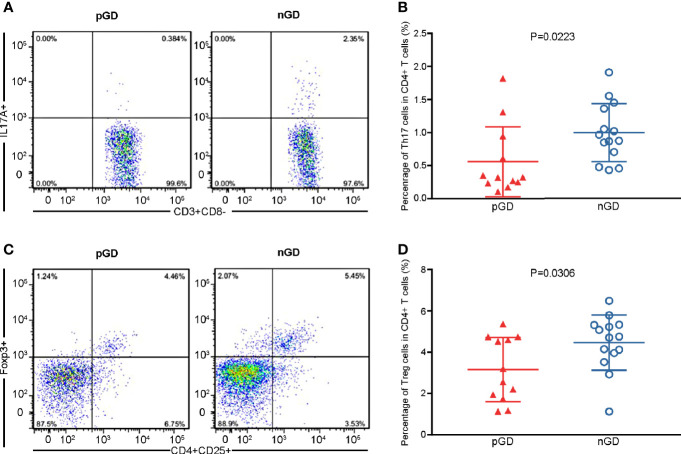
Flow cytometric analysis confirmed declined frequencies of Th17 and Treg cells in pGD patients. (A, C) Representative flow cytometry plots of (A) Th17 cells (IL17A+) gated in CD3+CD8− T cells and (C) Treg cells (CD25+Foxp3+) gated in CD4+ T cells from pGD (left) and nGD (right) patients respectively. The numbers denote the percentage of cells in each rectangle gate. (B, D) Whisker plots showed percentage of (B) Th17 cells and (D) Treg cells in CD4+ T cells in pGD (triangle, N = 12) and nGD (circle, N = 14) patients. Data were exhibited as mean with SD with individual values. pGD, persistent Graves’ disease; nGD, newly diagnosed Graves’ disease; SD, standard deviation.

