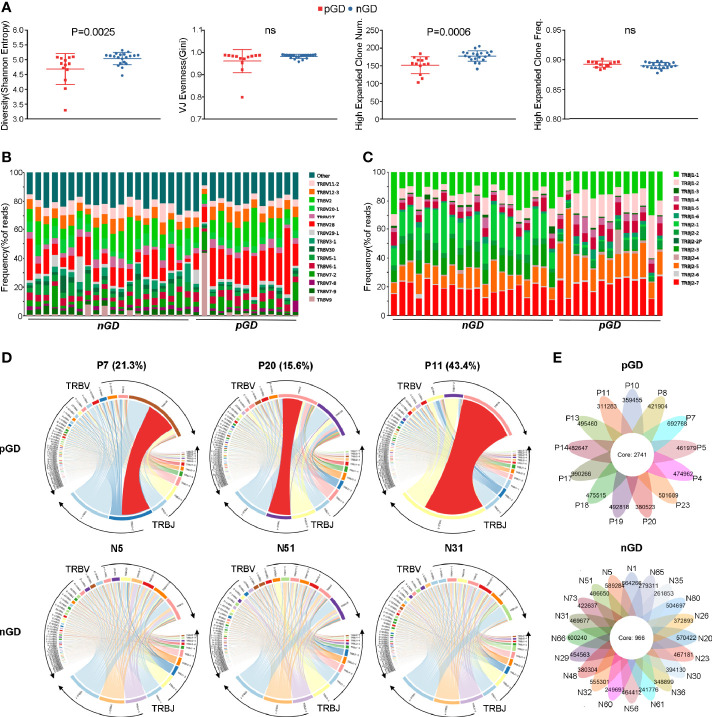
Figure 2.
Restricted TCR clonetype were revealed in pGD compared with nGD patients. (A) Whisker plots showed Shannon entropy, Gini, high expanded clone number, as well as high expanded clone frequency in pGD patients (red, N = 13) compared with nGD patients (blue, N = 20). Data were exhibited as mean with SD with individual values. (B, C) TCR (B) V segment and (C) J segment frequencies of reads in pGD patients (N = 13) compared to nGD patients (N = 20). Columns represent individual samples. The colors in the bars within each column indicate different V and J segments, and were denoted on the right. (D) TRBV and TRBJ gene segment usage and V-J recombination were illustrated by circos plots in sample pGD patients (upper) represented by P7, P20, P11 and nGD patients (bottom) represented by N5, N51, N31. The TRBV and TRBJ genes were clockwise arranged in the order of their frequency from low to high. A VJ recombination was illustrated by colored curved paths whose thickness represents their frequencies in TCR repertoires. (E) Flower plots presented the amount of the overlap (core) and individual (petal) in TCR clonotypes in pGD patients (upper, N = 13) and nGD patients (bottom, N = 20), respectively. Freq, frequency; pGD, persistent Graves’ disease; nGD, newly diagnosed Graves’ disease; SD, standard deviation; TCR, T cell receptor.

