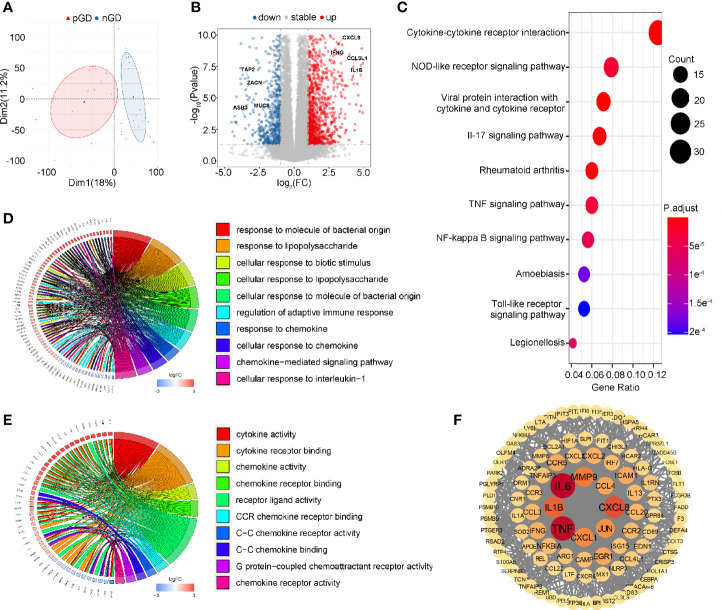
Figure 3.
Transcriptional profiling of PBMCs in pGD and nGD patients. (A) PCA plot showed obvious differences with all expressed genes in pGD and nGD group. Red triangle represented pGD and blue circle for nGD. (B) Volcano plot showed DEGs between pGD and nGD group. Blue dots represented downregulated genes (N = 375) and red dots were upregulated genes (N = 696). The texts denoted in the plot were names for corresponding genes. (C) The top 10 most significant KEGG pathways for all DEGs. Size of bubble represented counts of the DEGs in corresponding pathway and color of bubble meant adjust p value. (D, E) GO enrichment analysis of DEGs among (D) biological processes and (E) molecular functions. Circos plots showed the relationship between genes and GO terms. The top 10 most significant GO processes were shown in the plot retrospectively. (F) PPI network of potential key DEGs (degree ≧13). Size and color of each gene represented the its degree score. pGD, persistent Graves’ disease; nGD, newly diagnosed Graves’ disease; PCA, principal component analysis; DEGs, differentially expressed genes; KEGG, Kyoto Encyclopedia of Genes and Genomes; GO, Gene ontology; PPI, Protein-protein interaction.

