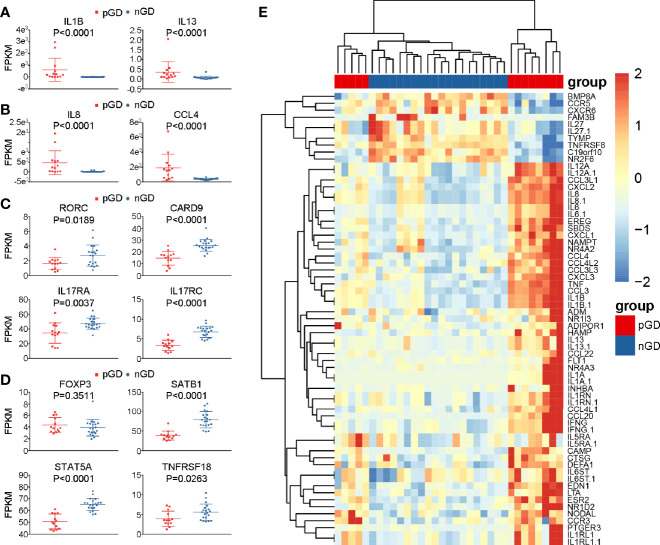
Figure 4.
Specific genes expression in pGD compared with nGD patients. (A–D) Whisker plots indicated normalized gene expression associated with (A) inflammation (B) chemotaxis (C) Th17 cells (D) Treg cells between pGD (red, N = 13) and nGD (blue, N = 20) samples. Data were exhibited as mean with SD with individual values. (E) The hierarchical clustering of 13 pGD and 20 nGD patients by differentially expressed immune related genes. The heatmap showed, for each gene, the scaled expression in each patient. pGD, persistent Graves’ disease; nGD, newly diagnosed Graves’ disease; SD, standard deviation; FPKM, fragments per kilobase of exon per million fragments mapped.

