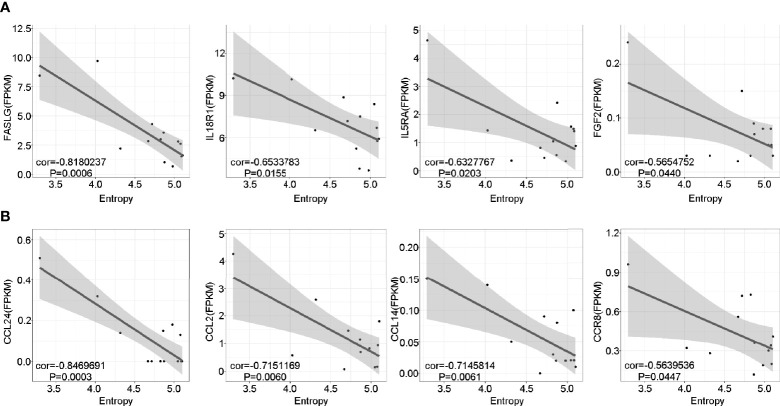
Figure 6.
Lower TCR diversity was correlated with inflammation and chemotaxis in pGD. (A, B) The correlations of TCR Entropy with the expression of (A) inflammation (B) chemotaxis associated genes in pGD patients (N = 13) by linear regression analysis using Pearson method. The gray zone represented 95% confidence intervals. Texts denoted in the left bottom corner were the correlation coefficient (cor) and P value. pGD, persistent Graves’ disease; TCR, T cell receptor.

