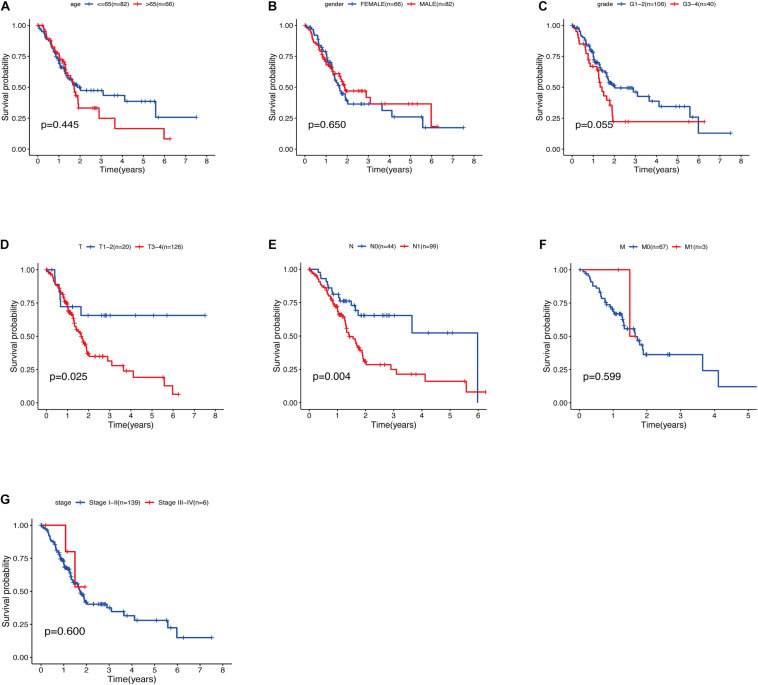
FIGURE 9.
(A) Relationship between age and survival of patients with PDAC. (B) Relationship between gender and survival of patients with PDAC. (C) Relationship between grade and survival of patients with PDAC. (D) Relationship between T stage and survival of patients with PDAC. (E) Relationship between N stage and survival of patients with PDAC. (F) Relationship between M stage and survival of patients with PDAC. (G) Relationship between stage and survival of patients with PDAC.

