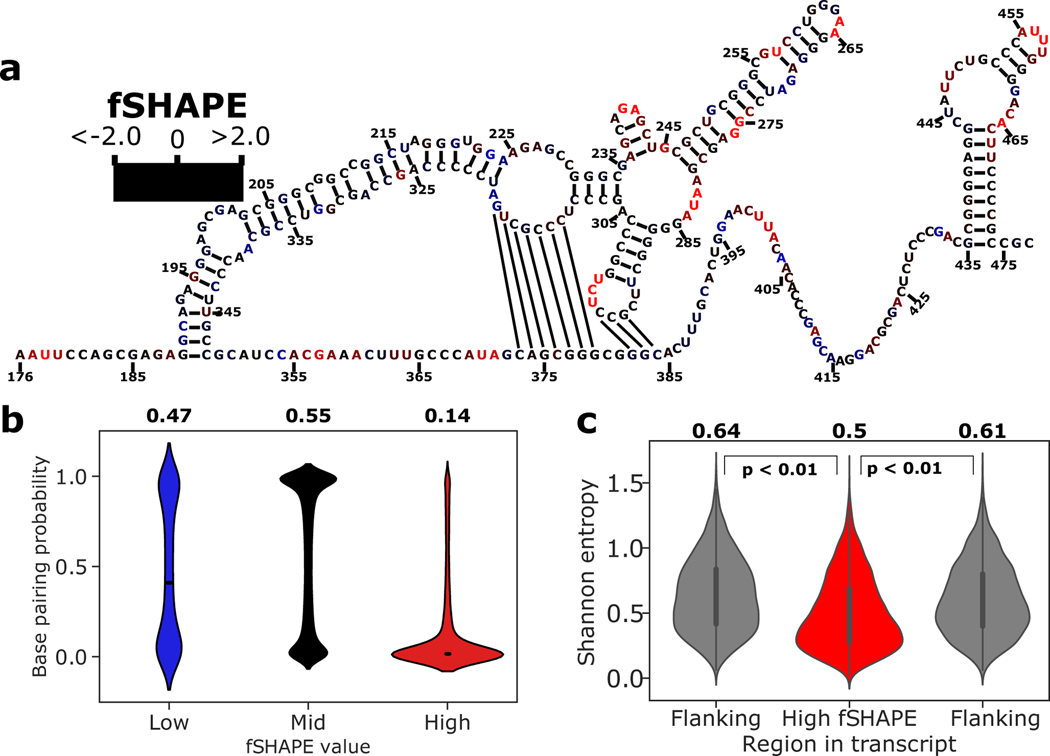
Figure 4.
fSHAPE reactivities in the context of RNA structure. (a) Example functional RNA structure, the internal ribosome entry site (IRES) of human MYC (c-myc) (Le Quesne et al., 2001), overlaid with corresponding fSHAPE reactivities in K562 cells. Nucleotides numbered by position in MYC transcript NM_002467. (b) Predicted base pairing probability densities for nucleotides grouped by low, medium, and high fSHAPE reactivities. Median and interquartile range displayed in white. Average base pairing probability indicated above each group. (c) Shannon entropy values predicted for 50-nucleotide regions containing high fSHAPE reactivities compared to 50-nucleotide flanking regions show a downward shift in Shannon entropy (p < 0.01). Median and interquartile range displayed in black. Average Shannon entropy indicated above each type of region. See also Figure S2.

