Figure 5.
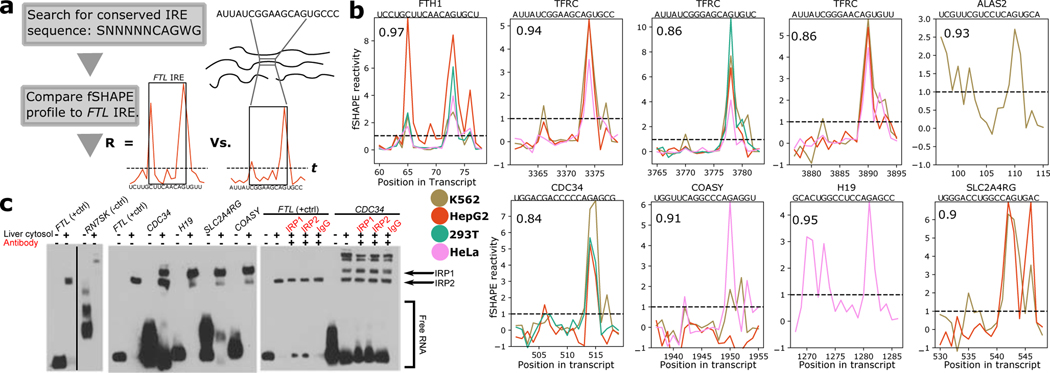
fSHAPE predicts uncharacterized iron response elements (IREs) bound by iron response protein 1/2 (IRP1 1/2). (a) A simple workflow for discovering IREs. Transcript sequences that match the conserved IRE sequence and have fSHAPE data are compared to the FTL IRE’s fSHAPE profile via correlation coefficient (R). R above 0.8 and fSHAPE reactivities at key positions above threshold t (dashed line) are selected as candidate IREs. (b) Selected fSHAPE profiles of IREs predicted by the workflow. Profiles are replicate averages. Pearson correlation compared to FTL is indicated in top left corner, gene name and sequence indicated above each plot. IREs in FTH1, TFRC, and ALAS2 (top row) have been previously verified (Stevens et al., 2011); predicted IREs in CDC34, COASY, H19, and SLC2A4RG (bottom row) are novel. Threshold (t) indicated with dashed line. (c) Electromobility shift assays testing predicted IREs for binding to IRP1 1/2. Biotin-labeled RNA is shown alone, incubated with liver cytosolic extract, or with antibodies (red) to IRP1, IRP2, or Immunoglobulin G (IgG; negative control). FTL IRE, which tightly binds IRP proteins, is shown as a positive control (Fillebeen et al., 2014); h3 stem loop of RN7SK shown as a negative control. Shifted bands in the presence of liver cytosol indicate RNA binding to protein. The release of RNA in the presence of antibodies indicates disruption of RNA-protein binding. See also Figure S4.

