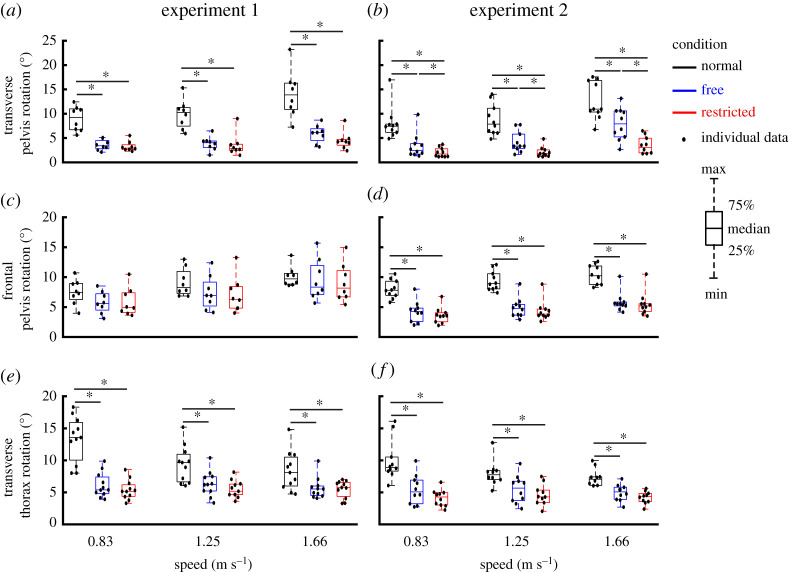
Figure 3.
Group average transverse pelvis rotation (a,b) and frontal pelvis rotation (c,d) as well as transverse thorax rotation (e,f) (median ± 25th percentile) at each walking speed in the Normal (black), stabilized conditions without transverse pelvis rotation restriction (blue) and with transverse pelvis rotation restriction (red) in Experiments 1 and 2. * denotes significant differences between conditions (based on the results of Bonferroni correction of Condition effect). Individual data are also plotted as dots.

