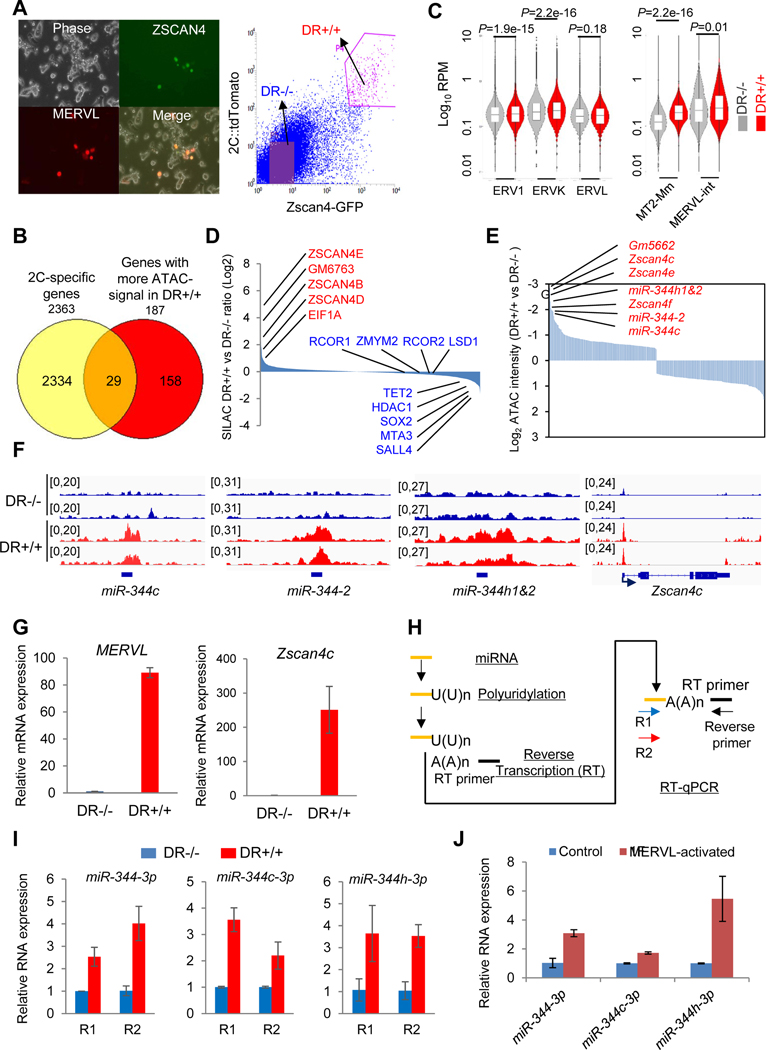
Figure 2. Discovery of miR-344 as a totipotency-associated miRNA.
(A) ESCs co-transfected with pZscan4c-GFP and 2C::tdTomato. (left) Phase contrast and fluorescence microscope images. (right) FACS plots of the pZscan4c-GFP and MERVL::tdTomato dual-reporter ESC line (DR+/+). Scale bars, 250 μm.
(B) Venn diagram for shared genes between 2C-specific genes (Macfarlan et al., 2012) and genes with significantly higher ATAC-signal in DR+/+ population.
(C) Chromatin accessibility of different genomic features determined by ATAC-seq analysis in DR−/− (gray) and DR+/+ (red) cells. Bars represent mean levels of accessibility. P-value is from Mann-Whitney test.
(D) Relative abundance of proteins in DR+/+ versus DR−/− cells identified by SILAC-MS.
(E) Open chromatin states of Zscan4 and miR-344 cluster gene loci in DR+/+ cells identified by ATAC-seq.
(F) Representative genomic regions (miR-344-2/c/h and Zscan4c) with higher ATAC-seq intensities (reads per million, RPM) in DR+/+ (red) cells.
(G) Relative expression of MERVL and Zscan4c in DR+/+ and DR−/− cells by RT-qPCR. Data are presented as average ± SD, relative to the levels in DR−/− cells.
(H) Strategy for mature miRNA measurement by RT-qPCR. Two miR-344-specific primers (R1/R2) and a common reverse primer are used to determine each miRNA expression.
(I) Relative expression levels of mature miR-344-3p, miR-344c-3p, and miR-344h-3p in DR+/+ versus DR−/− cells by RT-qPCR. Data are presented as average ± SD, relative to U6 control, and normalized to the levels in DR−/− cells.
(J) Relative expression levels of mature miR-344-3p, miR-344c-3p, and miR-344h-3p in control and MERVL-activated ESCs by F-sgRNA. Data are presented as average ± SD.

