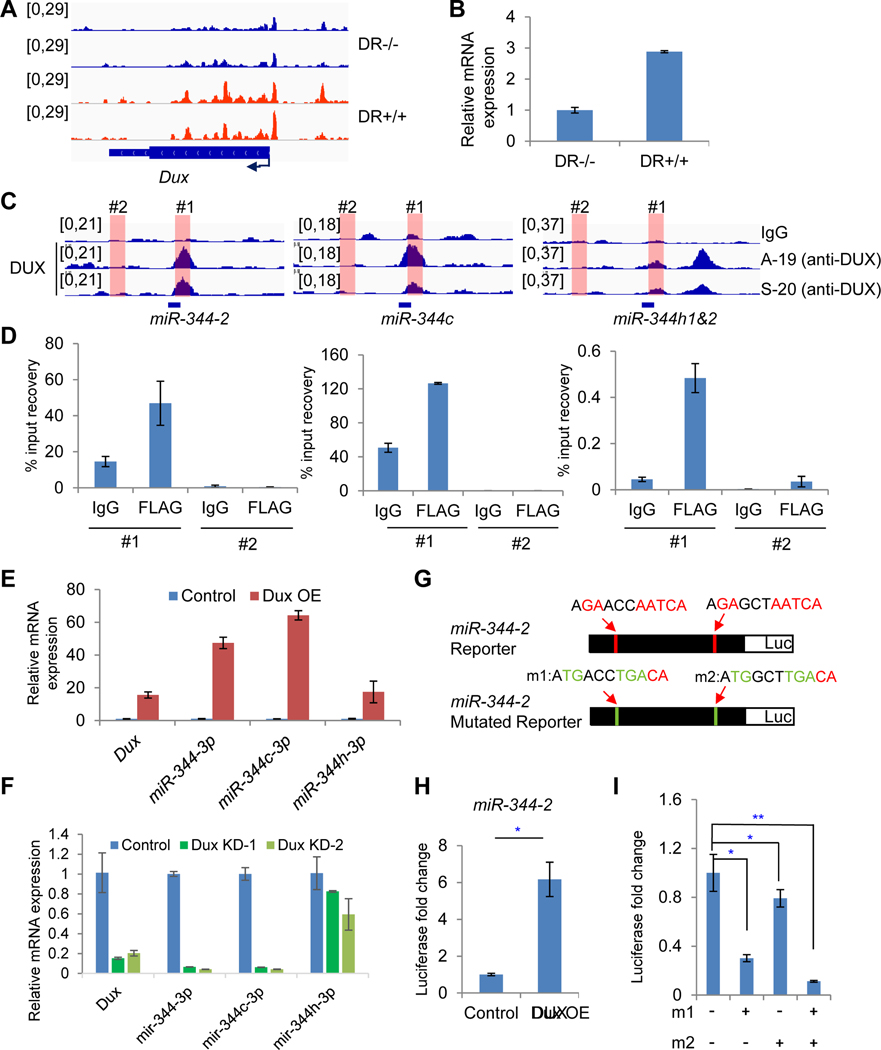
Figure 7. DUX binds to miR-344 promoter and activates miR-344 expression in MERVL+ cells.
(A) ATAC-seq tracks at Dux locus in DR+/+ (red) and DR−/− (blue) cells.
(B) RT-qPCR analysis of relative Dux expression in DR+/+ and DR−/− cells.
(C) ChIP-seq tracks of DUX (Whiddon et al., 2017) at miR-344-2, miR-344c, and miR-344h1&2 loci. Locations of primers for ChIP-qPCR analysis in panel D are indicated.
(D) ChIP-qPCR of DUX at miR-344-2 (left), miR-344c (middle), and miR-344h1&2 (right) loci. Region #1 is positive for DUX enrichment, whereas #2 is negative from DUX ChIP-seq data.
(E) RT-qPCR of Dux and mature miR-344-3p, miR-344c-3p, and miR-344h-3p expression upon Dux overexpression (OE) in mESCs.
(F) RT-qPCR of Dux and mature miR-344-3p, miR-344c-3p, and miR-344h-3p expression upon Dux knockdown in sorted MERVL+ mESCs. KD-1 and KD-2 are experiments with 2 independent shRNAs.
(G) Depiction of luciferase reporters containing miR-344-2 sequence with two DUX-binding motifs in wild type (top) or mutated (m1 and m2) version (bottom).
(H) Luciferase reporter assay in mESCs co-transfected with the miR-344-2 reporter and a DUX expression vector or a control. P-value is from T-test, *P < 0.05.
(I) Luciferase reporter assay in mESCs co-transfected with the miR-344-2 wildtype and mutated reporter and DUX expression vector. “m1 and m2” refer to the mutations at the two potential DUX motifs in panel G. P-value is from T-test, * P<0.05, ** P<0.01.
(B-H) The qPCR data are presented as average ± SD.

