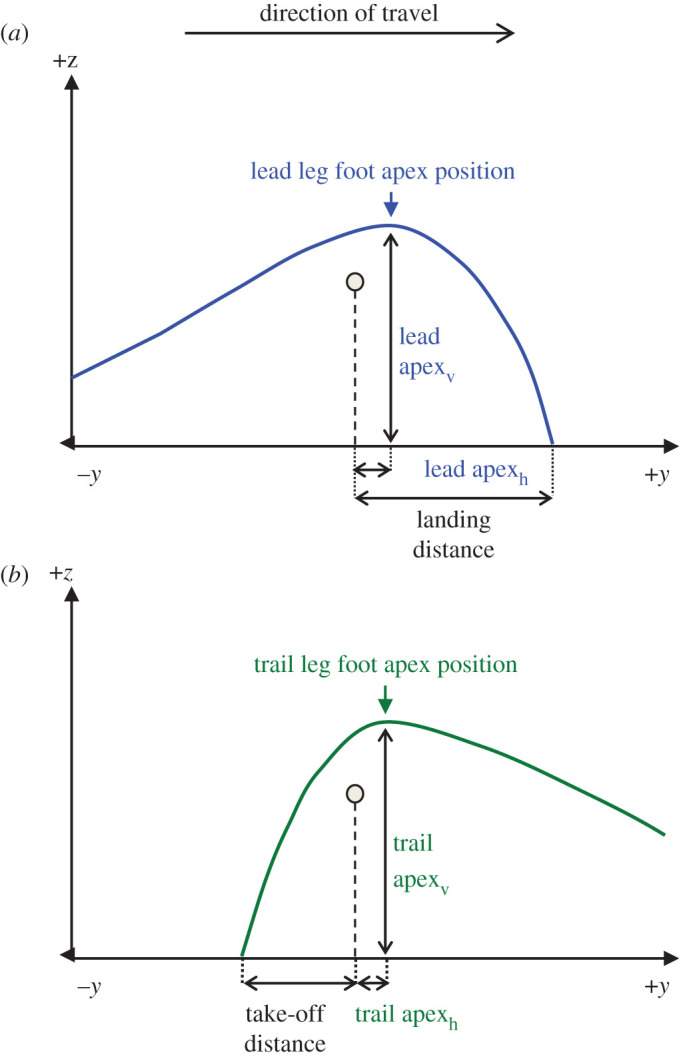
Figure 2.

Schematic lateral view diagram of lead leg (top) and trail leg (bottom) foot trajectories and the obstacle traversal parameters measured. Trajectory apex positions are described in the y (horizontal; direction of travel) axis and z (vertical) axis, where (y = 0, z = 0) is located at ground level vertically below the top edge of the obstacle. Further definitions and calculations are given in table 1.
