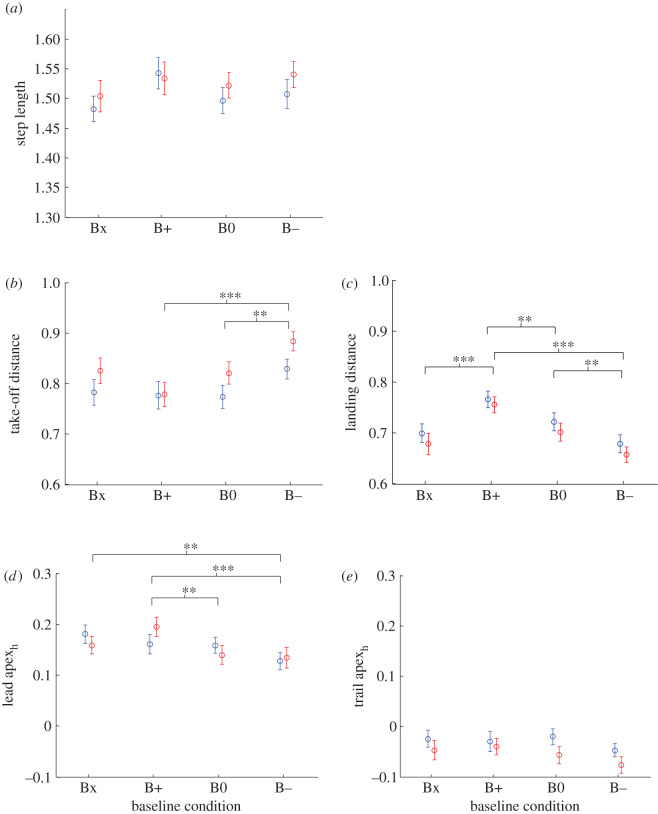
Figure 3.
Effect of obstacle condition on horizontal parameters. (a) Step length for the four obstacle conditions. Take-off distance (b) and landing distance (c) for the four obstacle conditions. Lead (d) and trail (e) foot peak apex horizontal positions for the four obstacle conditions. Circles indicate the mean value of the measured parameter for low obstacle crossings (blue) and the mean value of the measured parameter for high obstacle crossings (red). Error bars show ± s.e.m. The symbol * indicates a significant difference between baseline conditions at p < 0.05, ** at p < 0.01 and *** at p < 0.001.

