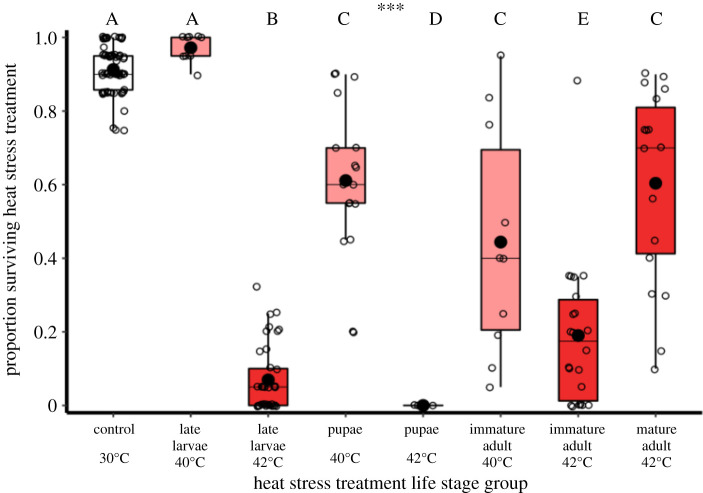
Figure 3.
Life stage survival rates following exposure to heat stress. Sample sizes, left to right: n = 68, 9, 38, 17, 5, 10, 20, 18. Data points are groups (containing 19.5 ± 4.5 s.d. individuals). Differences to 0 ± 0 survival of 42°C-exposed pupae were analysed using one-sampled Wilcoxon rank tests. Significance threshold: *** = p < 0.001.

