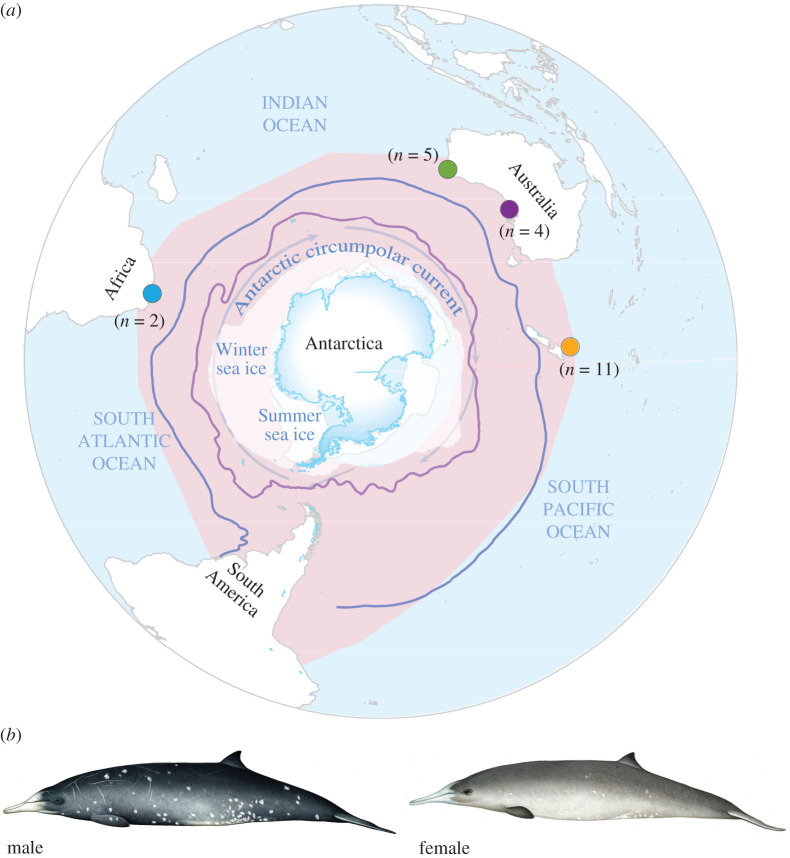
Figure 1.
Distribution, sampling locations and morphology of Gray's beaked whale. (a) Pink shaded area represents species distribution based on the IUCN Red List of Threatened Species [17]. Coloured circles denote sample locations: South Africa (blue), Western Australia (green), South Australia (purple), New Zealand (orange), and numbers denote sample sizes. Winter and summer sea ice coverage are indicated by white shading and correspond to average sea ice coverage during the months of March and September 2016 [18]. Subtropical convergence (blue line) and Antarctic polar front (purple line) are indicated [19]. Map scale is 1 : 95 000 000. (b) Male and female Gray's beaked whales; illustration by Mark Camm.

