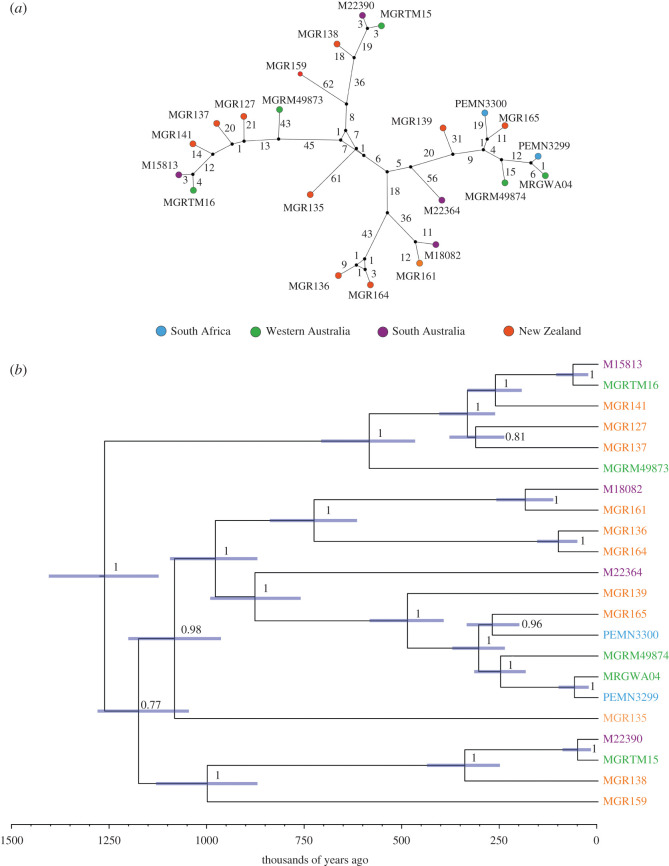
Figure 3.
The absence of geographic population structure in 22 Gray's beaked whale mitochondrial genomes. (a) Haplotype network of mitochondrial genomes. Nodes represent haplotypes, and colours correspond to sampling localities; black nodes represent theoretical, unsampled haplotypes; numbers adjacent to lines indicate the number of mutations between haplotypes. Distances between haplotypes are not to scale. (b) Dated mitochondrial phylogeny with node age error bars shown as blue indicating 95% highest posterior density for each divergence, and numbers show posterior probability values.

