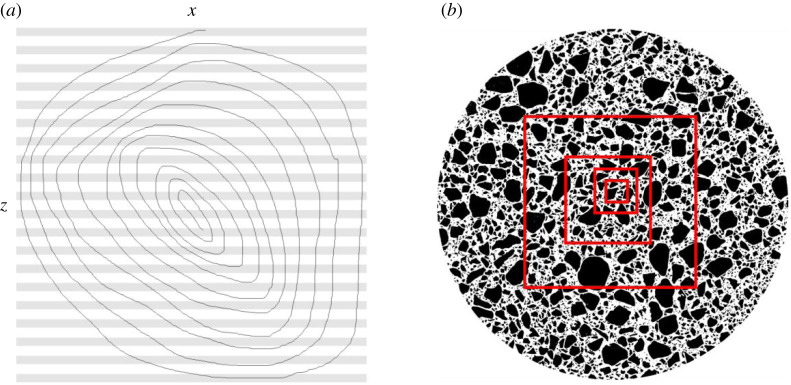
Figure 2.
Test images. (a) A spiral in xz (image dimensions 1024 × 3 × 1024 pixels) passing through multiple chunks tests the ability of the algorithm to connect subregions that are connected through multiple transitive steps via multiple chunks. Chunks are indicated by pale grey and white horizontal stripes. (b) s10up, a binarized XMT scan of a particulate material (2103 × 2103 × 1585 pixels) that contains one large particle and 437 507 smaller particles. Smaller cubic image stacks of 1024, 512, 256 and 128 pixels wide that were used to test performance scaling behaviour are indicated on the parent volume as red squares.

