FIGURE 1.
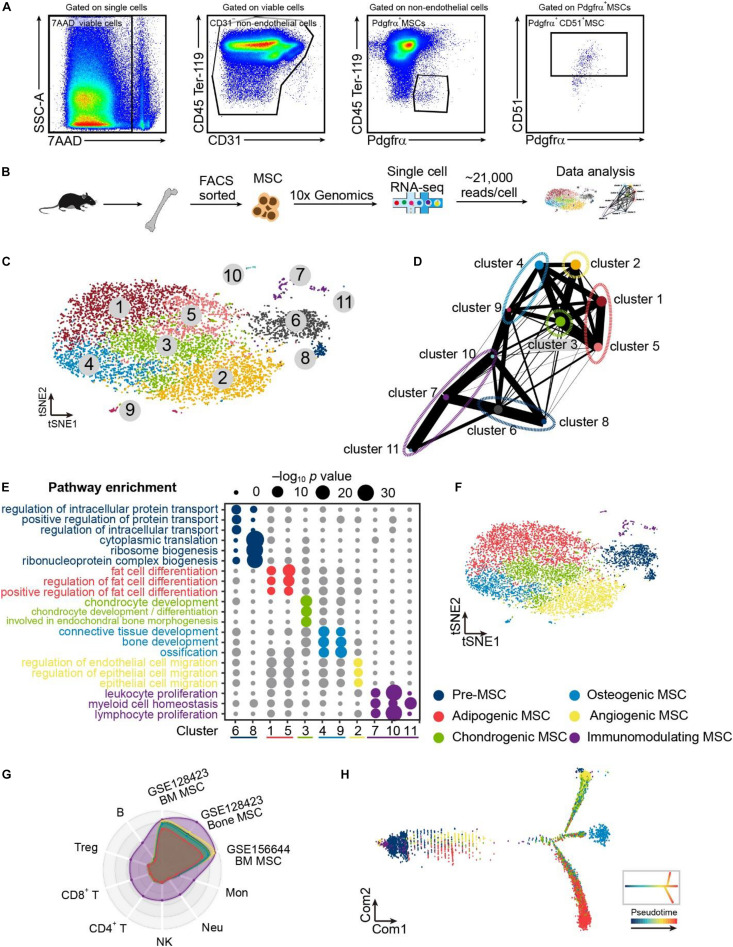
Single-cell atlas identifies heterogeneous MSC populations. (A) Flow cytometry gating for isolating bone marrow MSCs. (B) Schematic depicting the strategy of cell isolation, MSC sorting, single-cell RNA sequencing, and data analysis. (C) Clustering 8883 cells from MSCs by tSNE. (D) Results of PAGA. Each node represents a cluster, and edges show the connectivity between clusters. The size of nodes indicates the number of cells in each cluster, and the thickness of the edges denotes the connectivity from low (thin) to high (thick). (E) Eleven clusters annotating by gene sets of GO terms based on their signatures and dividing into pre-, adipogenic, chondrogenic, osteogenic, angiogenic, and immunomodulating MSCs. (F) Clustering 8883 cells from bone marrow MSCs annotating six populations inferred from PAGA results and enriched pathways of marker genes. (G) Radar chart showing the spearman rho between the MSC scRNA-seq result in this study compared with the published MSC and immune cell scRNA-seq results. Each ring represents one population in (F). (H) Developmental pseudotime of MSCs. The inset depicts the schema of pseudotime of MSCs.

