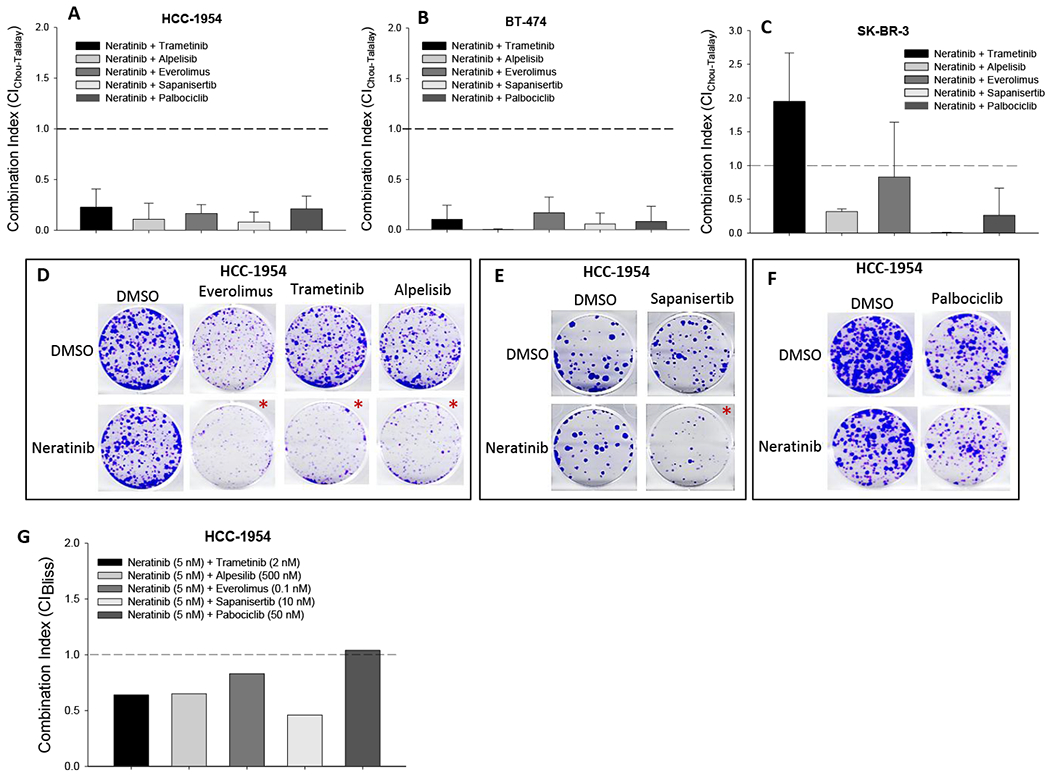
Figure 1. Effects of neratinib combination on cell growth of HER2+ cells.

(A-C) Cell viability assay. HER2+ HCC-1954 (A), BT-474 (B), and SK-BR-3 (C) cells, seeded in 96-well plates, were treated with neratinib together with individual drugs (trametinib, alpelisib, everolimus, sapanisertib, and palbociclib) at combinatorial dose ratios (0.11 ~ 500). 72 hours after treatment, cell viability was determined by SRB staining. IC50s of each drug in both single and combination treatment were calculated from each sigmoid curve using the GraphPad Prism program. Triplicate wells were used for each concentration. Combination index (CI) was calculated using the Chou-Talalay drug combination model based on IC50 of single and combination treatments. Average CI was obtained from 3-5 cell viability assays as described above. (CI < 1.0: synergistic; CI = 1.0: additive; CI > 1.0: antagonistic). The depicted values represent average ± standard deviation from biological triplicate. (D-F): Colony formation assay. HCC-1954 cells, seeded in 6-well plates, were cultured for 3 weeks with single drug or combinatorial treatment, including neratinib (5 nM), everolimus (0.1 nM), trametinib (2 nM) and alpelisib (500 nM), sapanisertib (10 nM) and palbociclib (50 nM) and combinations. (*: synergistic combination) Data were from triplicate wells. (G) CI of colony formation. Total colony area was quantitated using ImageJ program and normalized with vehicle controls. Effect-based CI was calculated using Bliss combination analysis model based on inhibition percentage of single drug and combination treatment. (CIBliss < 1.0: synergistic; CIBliss = 1.0: additive; CIBliss > 1.0: antagonistic).
