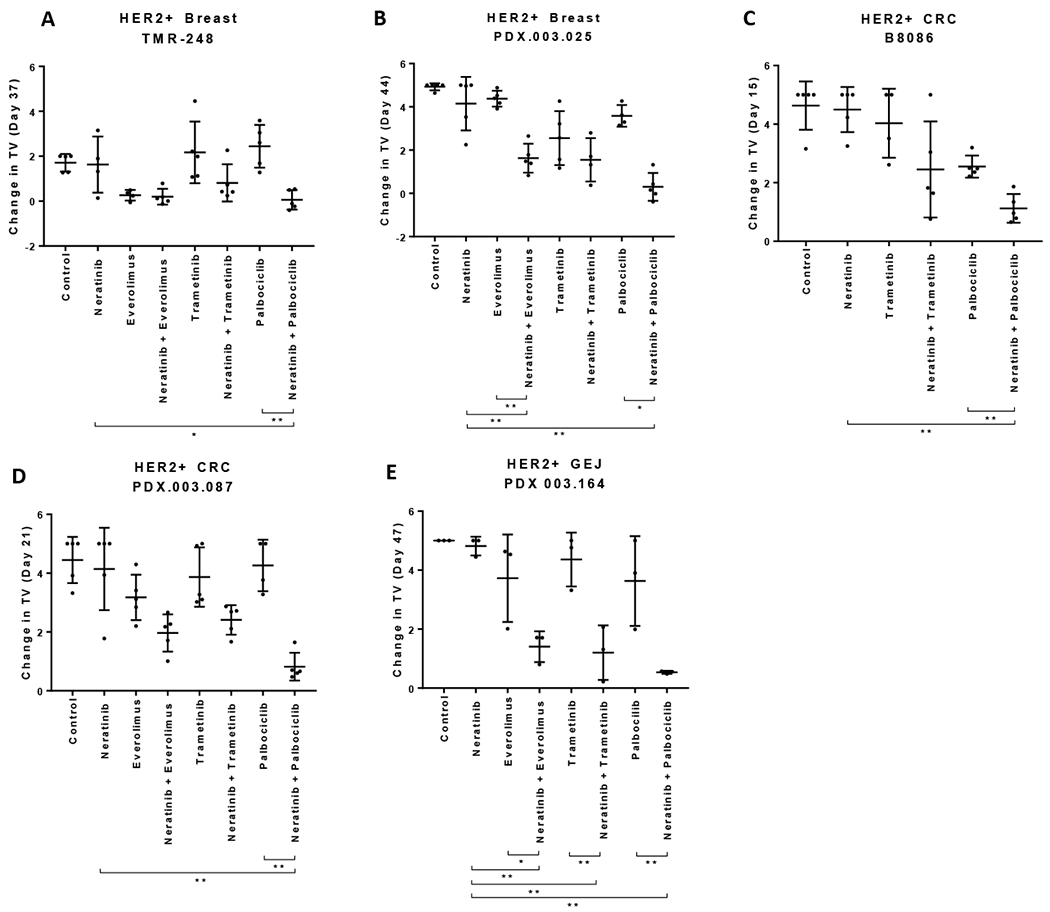
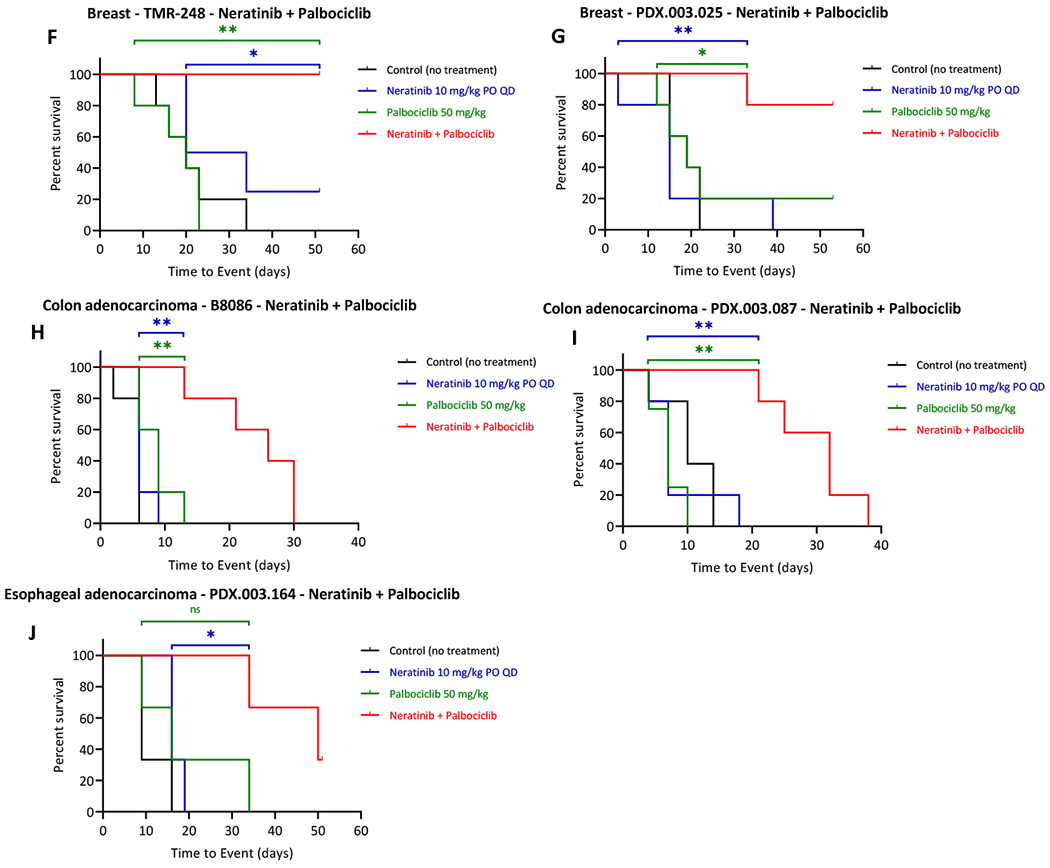
Figure 3. Effects of neratinib combination on tumor growth of HER2+ PDXs.


Nude mice bearing the individual PDX tumors,TMR-248 (A, F), PDX.003.025 (B, G), B8086 (C, H), PDX.003.087 (D, I), and PDX.003.164 (E, J) were orally administered with neratinib, everolimus, trametinib, and palbociclib at 10, 5, 0.3 and 50 mg/kg respectively or their combinations, daily for the length of experiment. (A-E) Change in tumor volume (TV). Tumor volume were measured at the end time points. Y axis value are relative change in TV calculated as (TVDayX – TVDay0) /TVDay0. (F-J) Kaplan-Meier event-free survival curves responding to neratinib combination with palbociclib. Tumor volume was measured longitudinally. Kaplan-Meier curves were generated with time to event (tumor doubling in size or meeting criteria for euthanasia per protocol) vs percent survival rate. Statistics are shown for the comparison showing significance combination versus single agent (ns: p>0.05; *: p≤0.05; **: p≤0.01). For in vivo studies, one-way ANOVA tests followed by Tukey was used by Dunnett’s multiple comparison. The depicted values represent mean ± SEM.
