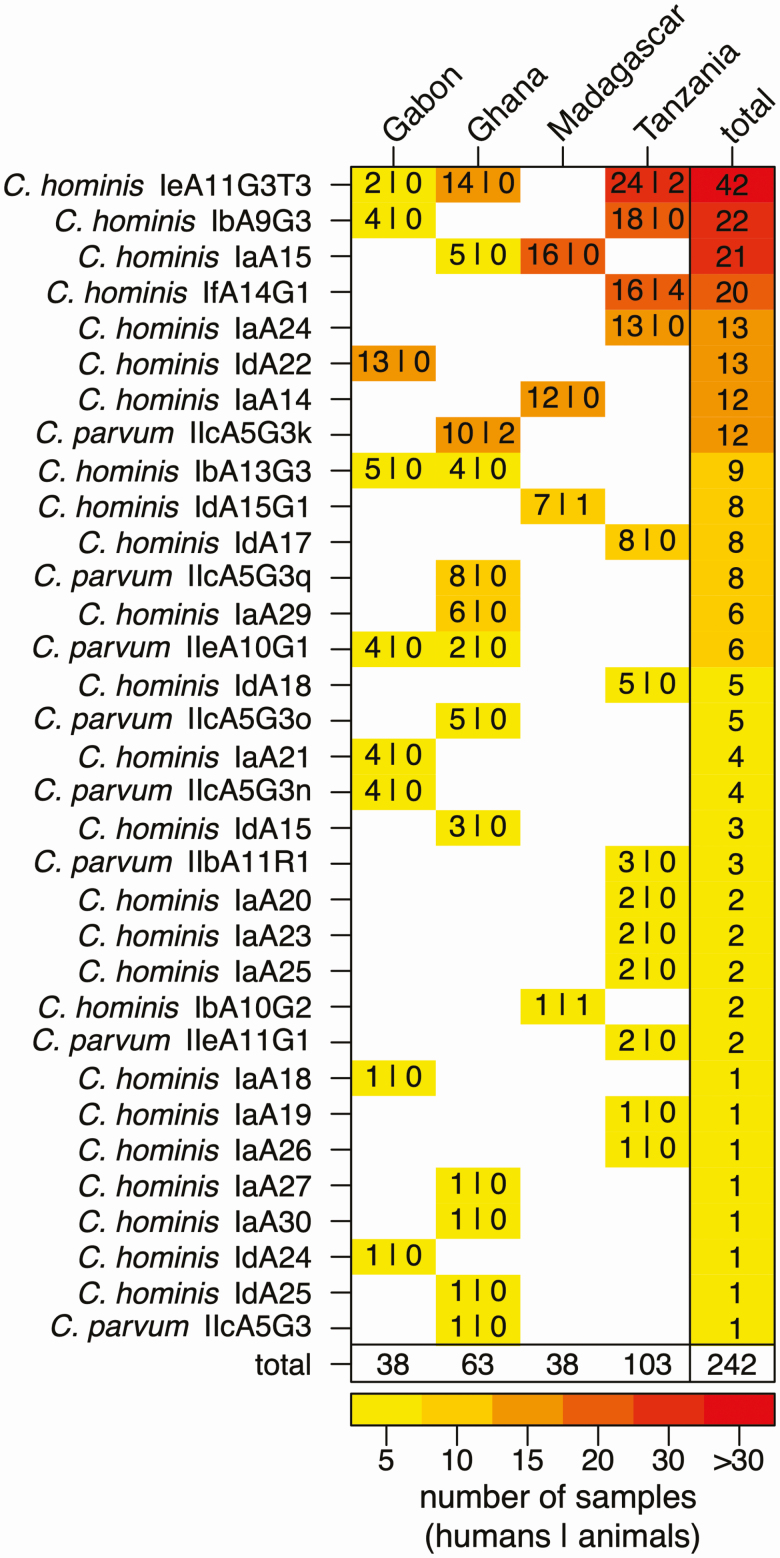
Figure 2.
Frequency of Cryptosporidium gp60 subtypes at the 4 study sites. Frequencies of gp60 subtypes at the 4 study sites are presented for humans (first number) and animals (second number) along with strain and study site totals. The heatmap displays the lowest frequencies in yellow and the highest frequencies in red.

