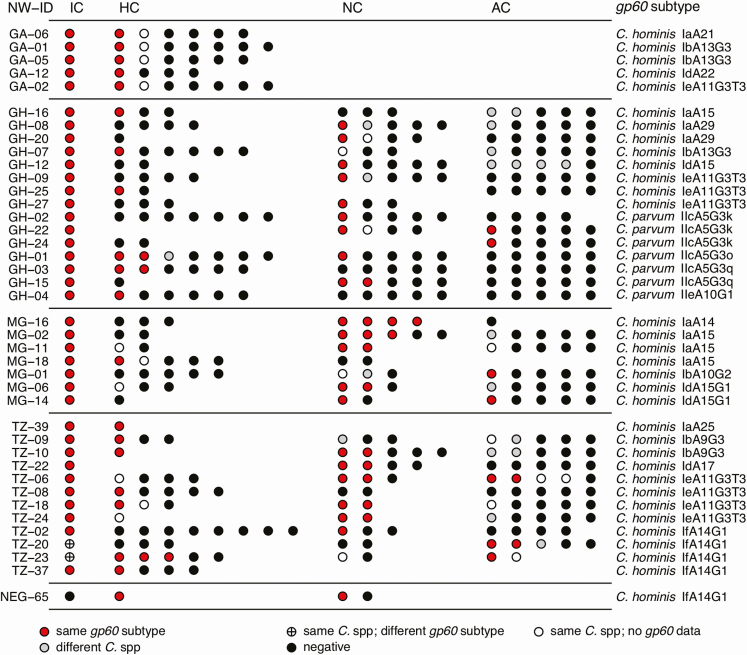
Figure 4.
Transmission clusters of individual study subjects (circles) with identical gp60 subtypes among contact networks at the different study sites. Cluster structures are displayed, including study subjects infected with the same Cryptosporidium species but lacking gp60 data, which could potentially be related to the detected cases. The occurrence of differing, non-cluster-defining Cryptosporidium species within networks is also shown. Abbreviations: AC, animal contact; C., Cryptosporidium; GA, Gabon; GH, Ghana; HC, household contact; IC, initial case; MG, Madagascar; NC, neighboring child; NW-ID, network identifier as defined in Supplementary Figure 1; TZ, Tanzania.

