FIGURE 1.
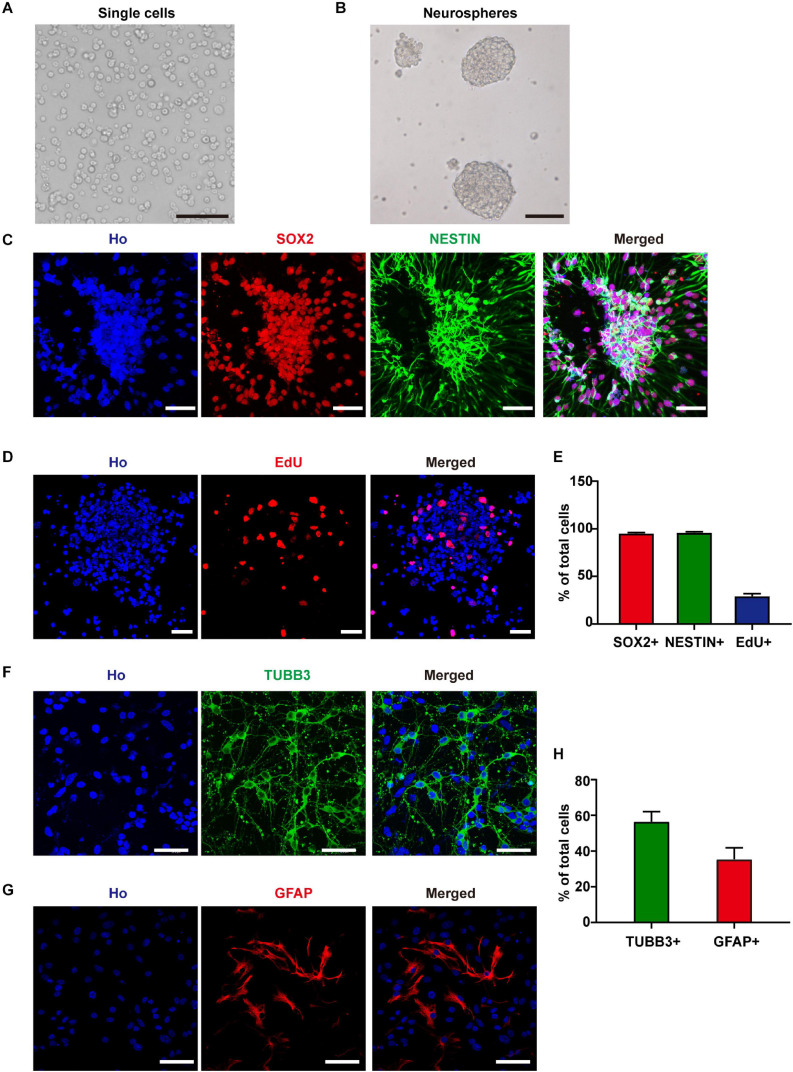
Neural stem cells (NSCs) identification and differentiation. (A) Cells isolated from E11.5 mouse telencephalons. Scale bar, 100 μm. (B) The single cells formed neurospheres after 6 days of in vitro culture. Scale bar, 100 μm. (C) SOX2 and NESTIN staining of cultured neurospheres. Scale bar, 50 μm. (D) EdU staining of cultured neurospheres. Scale bar, 50 μm. (E) Statistic data of the percentage of SOX2+, NESTIN+, and EdU+ cells. (F–H) TUBB3 and GFAP staining and statistic data of NSC-derived cells. Scale bar, 50 μm.

