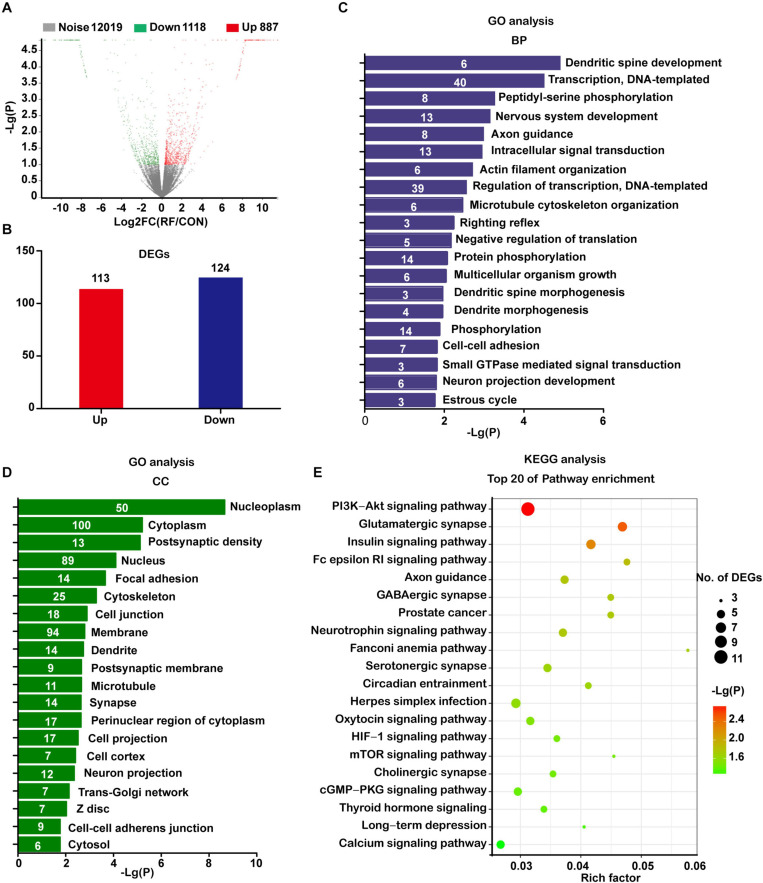
FIGURE 2.
Transcriptomic profile of NSC-differentiated cells after 1800 MHz RF-EMF exposed for 48 h. (A) The volcano graph shows all the DE transcripts with the criteria condition of Padjust < 0.1 and divergence probability ≥ 0.8. (B) DE transcripts filtered by the criteria: Padjust < 0.1, divergence probability ≥ 0.8 and |FC| ≥ 1.5. (C,D) Results of top items of biological process (BP) and cellular component (CC) from GO analyses. The number in the bar represents the number of DE transcripts in each item. (E) Bubble chart showing the results of the top 20 KEGG pathways. Rich factor refers to the ratio of DE transcripts in KEGG pathways.

