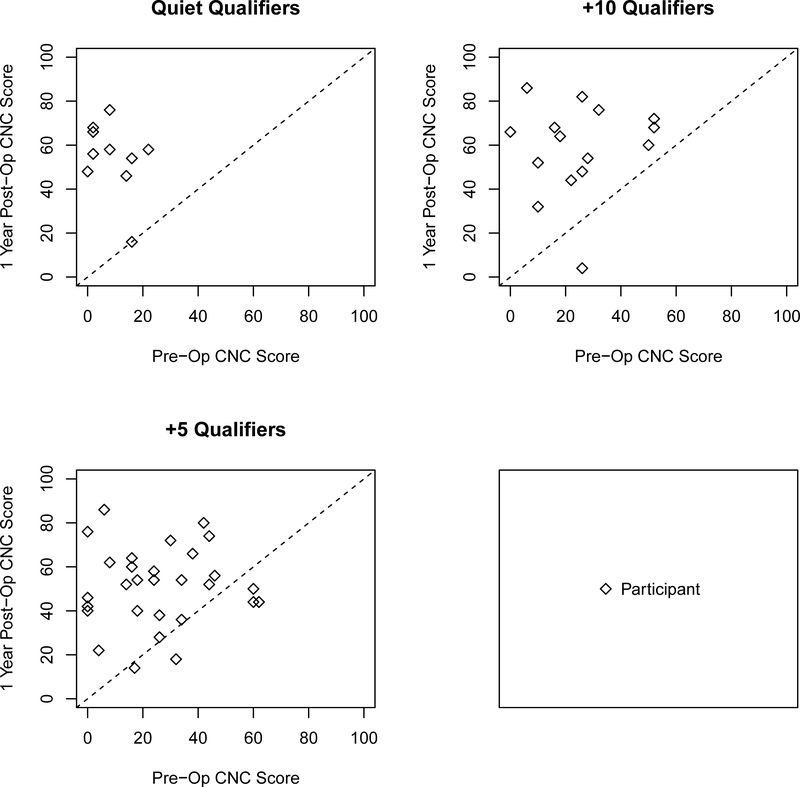
Figure 1.
Scatter plot comparing CI alone postoperative CNC scores as a function of the aided operative ear CNC scores for all three groups. Shapes represent candidacy group. Data falling below the dotted diagonal line indicate decrement in score one year postoperative. Data falling above the dotted diagonal line indicate improvement in score since implantation.

