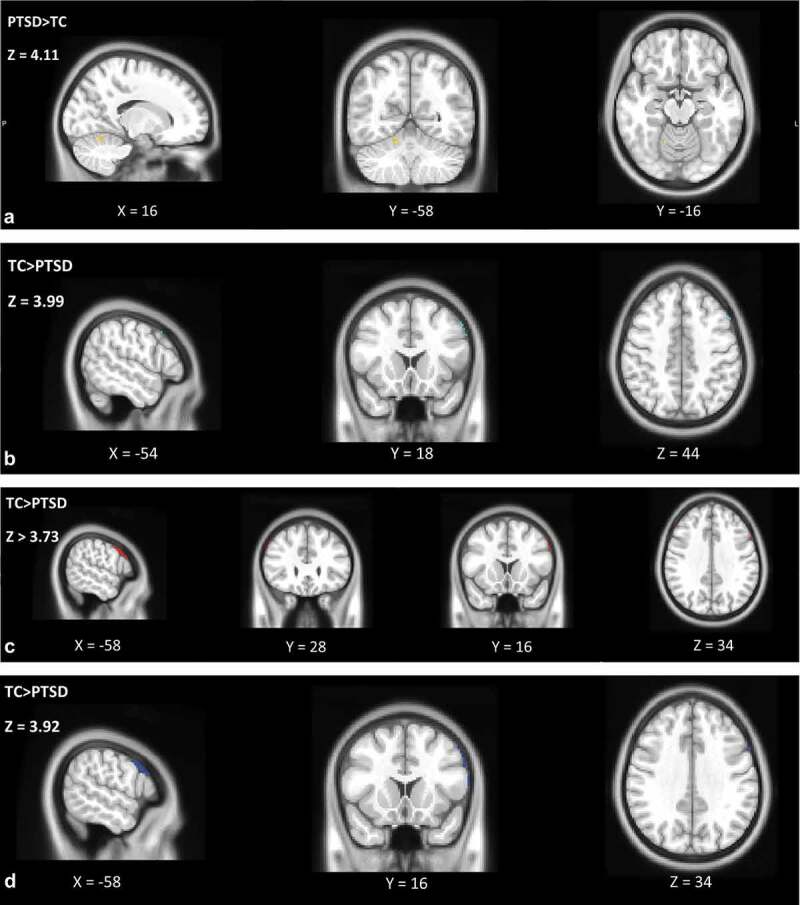
Figure 2.

Representations of the significant increased functional connectivity clusters between adolescents with high PTSD symptoms vs. trauma-exposed controls for (a). the right hippocampus with the right cerebellum during Stress vs. Baseline for PTSD symptom group>TC group; in yellow, (b). the right hippocampus and left MFG during Recovery vs. Baseline for the TC>PTSD symptom group; in light blue, (c). the left hippocampus and left IFG and left hippocampus and right MFG during Recovery vs. Baseline for the TC>PTSD symptom group; in red, and (d). the mPFC and left IFG during Recovery vs. Baseline for the TC>PTSD symptom group; in dark blue. Significance level was defined as cluster p-values <.05 after FDR correction (α = 0.01), PTSD symptom group n = 17, TC n = 22
