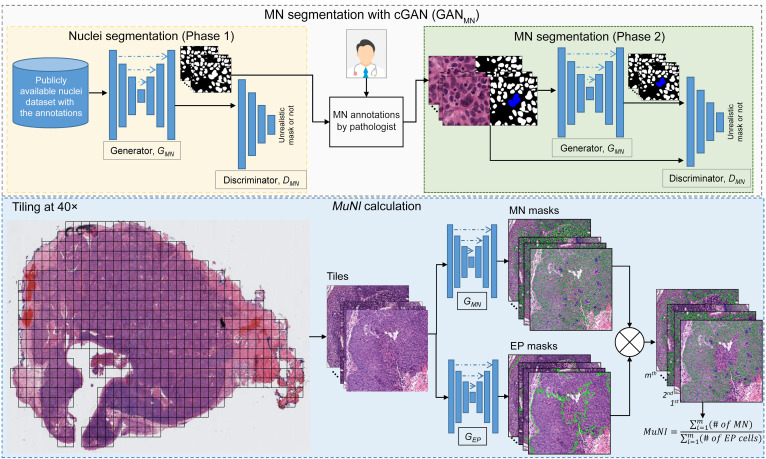
Figure 2. Overall flowchart of the image analysis pipeline.
The training step involved building MN and EP segregators. The same deep-learning architecture, cGAN, was used to build the segregators. Each block in the cGAN models consisted of convolution, BatchNorm, and ReLU layers. The MuNI calculation phase started with the extraction of tiles from tissue regions. The tiles were then input into the MN and EP models separately. Finally, the MuNI was calculated automatically, which was the ratio of MNs within EP regions to EP cells.

