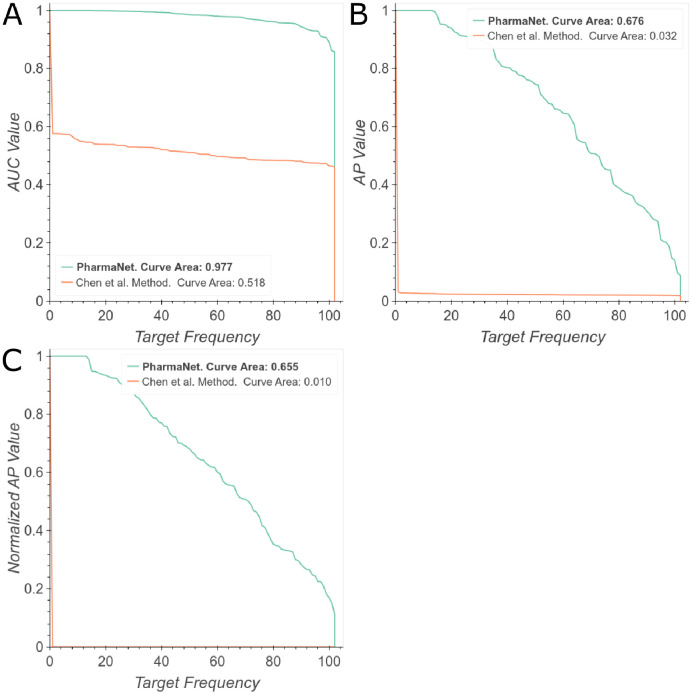
Fig 3. Comparison of PharmaNet against the state-of-the-art method of [24].
The curves correspond to the frequency in the 102 targets for each metric score: (A) Area Under the ROC Curve, (B) Average Precision, (C) Normalized Average Precision. We report area under the frequency curve. Best viewed in color.

