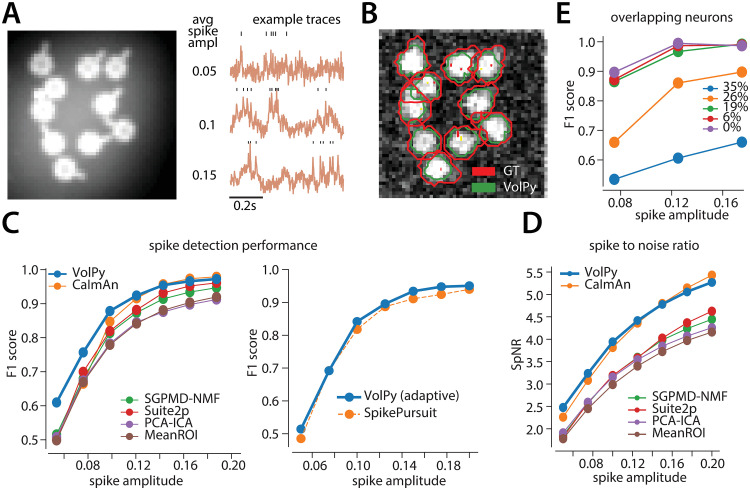
Fig 4. Evaluation of VolPy on simulated data.
(A) Example of simulated data. Left. Average of movie across time. Right. Three example traces with different average spike amplitude. Higher spike amplitude are associated with higher signal to noise ratio. (B) The result of Mask R-CNN in segmenting the simulated movie (0.1 spike amplitude) laying over the correlation image. (C) Performance of VolPy, CaImAn, SGPMD-NMF, Suite2P, SpikePursuit, PCA-ICA and MeanROI on simulated data. Average F1 score against ground truth in function of spike amplitude. (Left) All algorithms (including VolPy) were evaluated with the optimal threshold. (Right) Comparison with SpikePursuit, adaptive threshold in both cases. (D) Spike-to-noise ratio (SpNR) in function of spike amplitude. (E) Evaluation of VolPy on overlapping neurons. Average F1 score detecting spikes in function of spike amplitude and overlap between two neurons.

