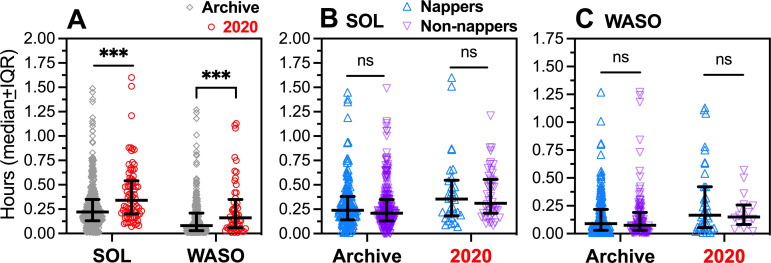
Fig 8. Sleep onset latency (SOL) and wake-after-sleep-onset (WASO) for the 2020 group (red circles, N = 80) and archive group (grey diamonds, N = 452), averaged across all days (work and free).
[A]. All subjects. [B]. SOL in nappers (archive group N = 183, 2020 group N = 50) and non-nappers. [C]. WASO in nappers and non-nappers. Between-group contrasts by Mann-Whitney U test. *p < .05, **p < .01, ***p < .0005, ****p < .0001.

