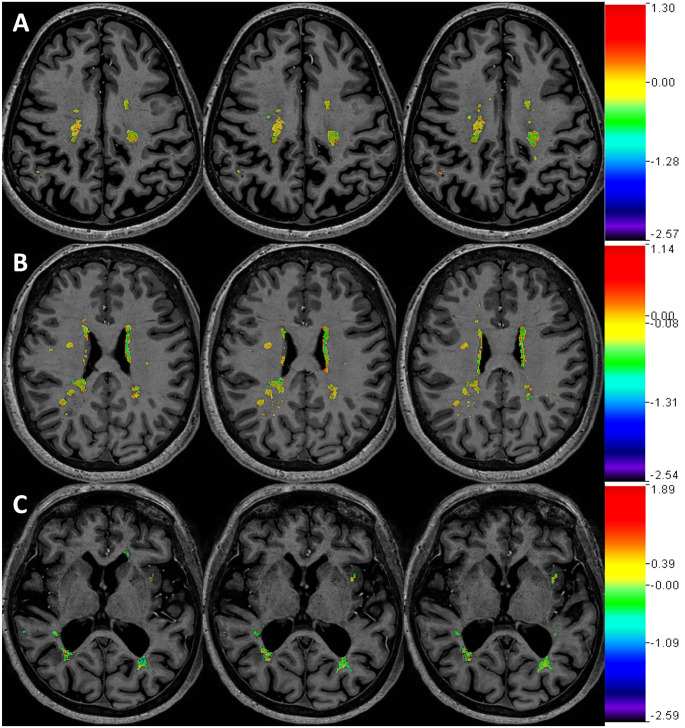
Fig 2. Magnitude of ΔT1 in non-enhanced lesion areas.
Shown are images from three separate participants (A: SPMS/female/53, B: RRMS/female/52, C: SPMS/female/61). Color maps of ΔT1 (units: s) in NEL’s were overlaid upon T1-weighted images. Each color bar (not scaled) displays the full range of ΔT1 only within NEL of the corresponding participant. Three representative participants shown for display purposes (analysis was in all subjects). Each row shows three consecutive image slices of a single participant. SPMS = secondary progressive multiple sclerosis; RRMS = relapsing-remitting multiple sclerosis; BBB = blood-brain barrier; NEL = non-enhancing lesion.

