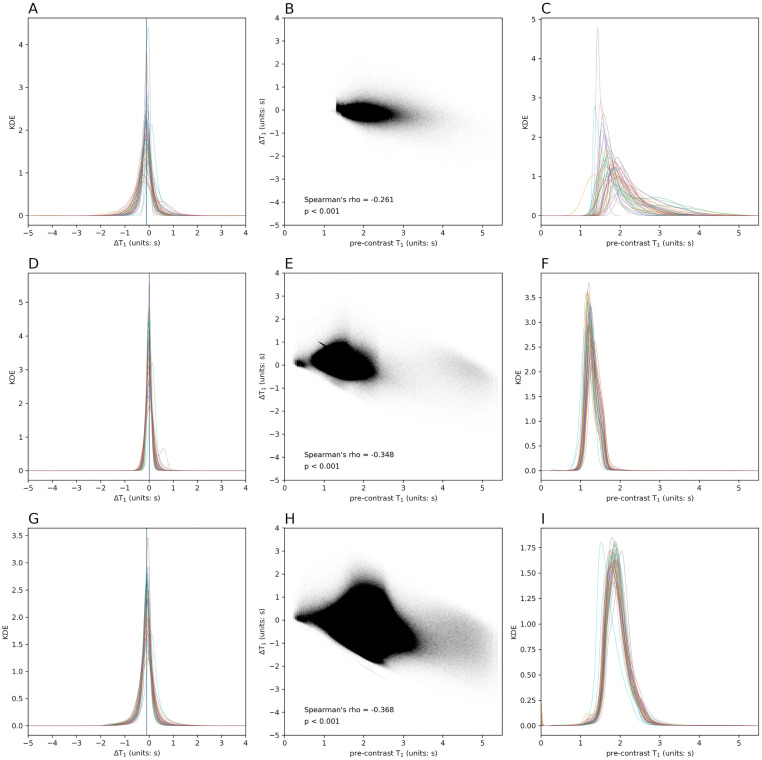
Fig 3. ΔT1 and Pre-contrast T1 in NEL, NAWM, cGM of entire cohort.
A: Overlaid kernel density estimations (KDEs) of ΔT1 in NEL. Each colored line represents the smoothed histogram using KDE for all voxels in one subject. Blue vertial line indicates voxel-wise mean ΔT1 value (-0.116 s), and green line denotes voxel-wise median ΔT1 value (-0.105 s). B: Per voxel Spearman’s rho coefficient for the relationship of pre-contrast T1 and ΔT1 of all NEL voxels of the entire cohort shows a weak correlation, which indicates that observed ΔT1 is not solely driven by initial T1 before contrast agent administration. C: Overlaid KDEs of pre-contrast T1 in NEL D: Overlaid KDEs of ΔT1 in NAWM. E: Per voxel Spearman’s rho coefficient in NAWM shows a stronger correlation than NEL (blue line, mean ΔT1 of 0.011 s; green line, median ΔT1 of 0.002 s). F: Overlaid KDEs of pre-contrast T1 in NAWM. G: Overlaid KDE of ΔT1 in cGM (blue line, mean ΔT1 of -0.107 s; green line, median ΔT1 of -0.091 s). H: Per voxel Spearman’s rho coefficient in cGM also shows a stronger correlation than NEL. I: Overlaid KDEs of pre-contrast T1 in cGM. NEL = non-enhancing lesion, NAWM = normal-appearing white matter, cGM = cortical gray matter.

