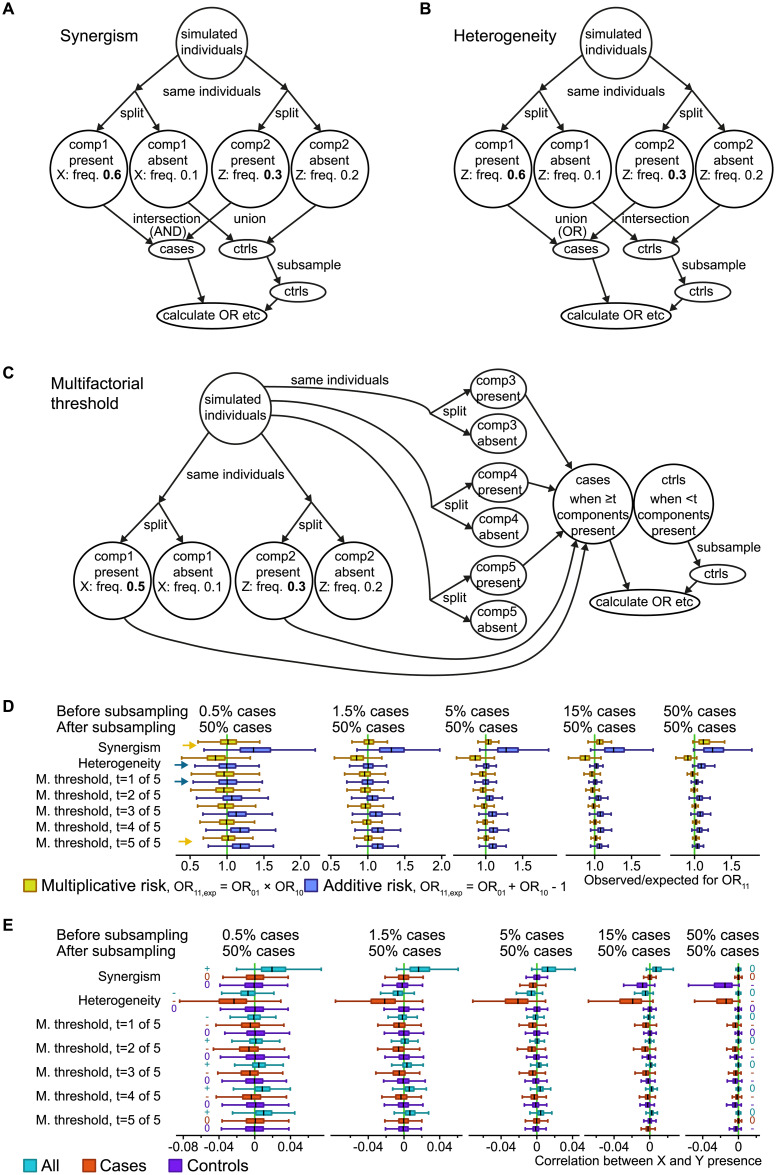
Fig 1. Three simulated causal scenarios with selection of equal numbers of cases and controls.
A-C: Simulation schemes for three generalized scenarios in a case-control study context: Synergism of causes (A), heterogeneity of causes (B), and a multifactorial or 5-factor threshold (C). The numbers are example frequencies, and numbers in bold highlight the higher frequencies of the simulated risk factors (X and Z) associated with disease. For example, “Z: freq. 0.3” means that each simulated individual in the group had a 30% chance of being assigned the risk factor Z. Numbers in italic are the average frequency in the other group of simulated individuals; note that this will depend on the prevalence (which is adjusted in the scenarios in the “split” into cases and controls). “Components” (comp1 and comp2) were used as a strategy to obtain probabilistic risk factors. D: ORs for double risk (OR11) were calculated from the simulation scenarios, with boxes summarizing 1,000 simulation runs with different risk factor frequencies. The observed OR11 were compared to the expected combinations of the odds ratio for single risk (OR10 and OR01) in the additive and multiplicative models. Boxplots show median and quartiles for the simulations, but extreme values are omitted for clarity. Yellow arrows highlight where the median is visibly close to the null hypothesis for the multiplicative model, while blue arrows do the same for the additive model, for the two most extreme simulated prevalence rates. “M. threshold” refers to multifactorial threshold (scenario C). E: Correlation coefficients between the risk factors X and Z, for three sample sets (all, cases only, controls only). The relevant signal in each case is whether the median is negative, zero or positive, highlighted with a -, 0 or + symbol for the two most extreme simulated prevalence rates.

