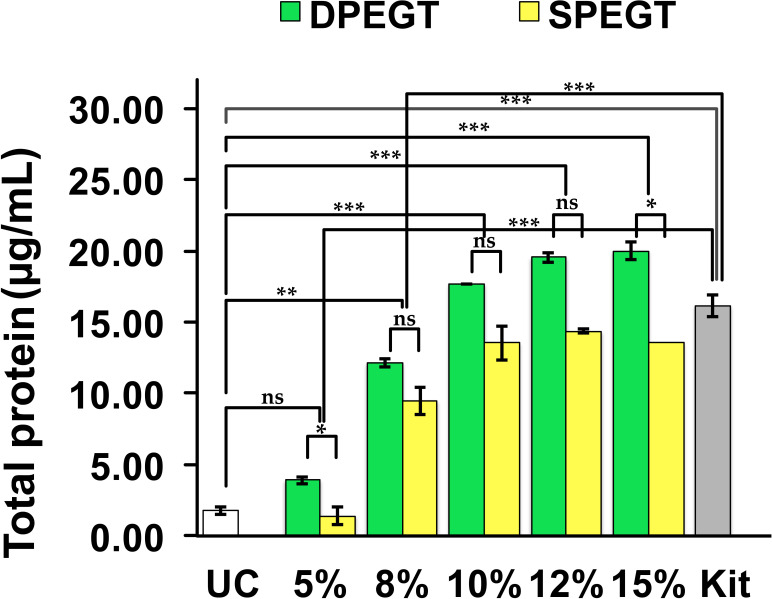
Fig 3. Total protein content of enriched plasma sEVs.
Isolation of sEVs was conducted by PEG-based methods SPEGT, DPEGT, and the miRCURY kit and UC. Data represent the mean ± SEM, n = 12. *** p < 0.001, ** p < 0.01, * p < 0.05 and ns (not significant) as determined by either Student’s t-test or ANOVA test.

